510
Example 33
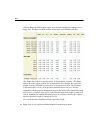
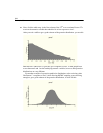
E Next, click the table entry in the first column of the 22
nd
row to estimate Person 22’s
score on the numeric variable that underlies his or her response to item1.
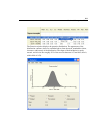
After you wait a while to get a good estimate of the posterior distribution, you see this:
Both Person 1 and Person 22 gave the agree response to item1, so both people have
scores between 0 and 1 on the underlying numeric variable; however, their posterior
distributions are very different
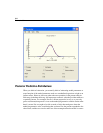
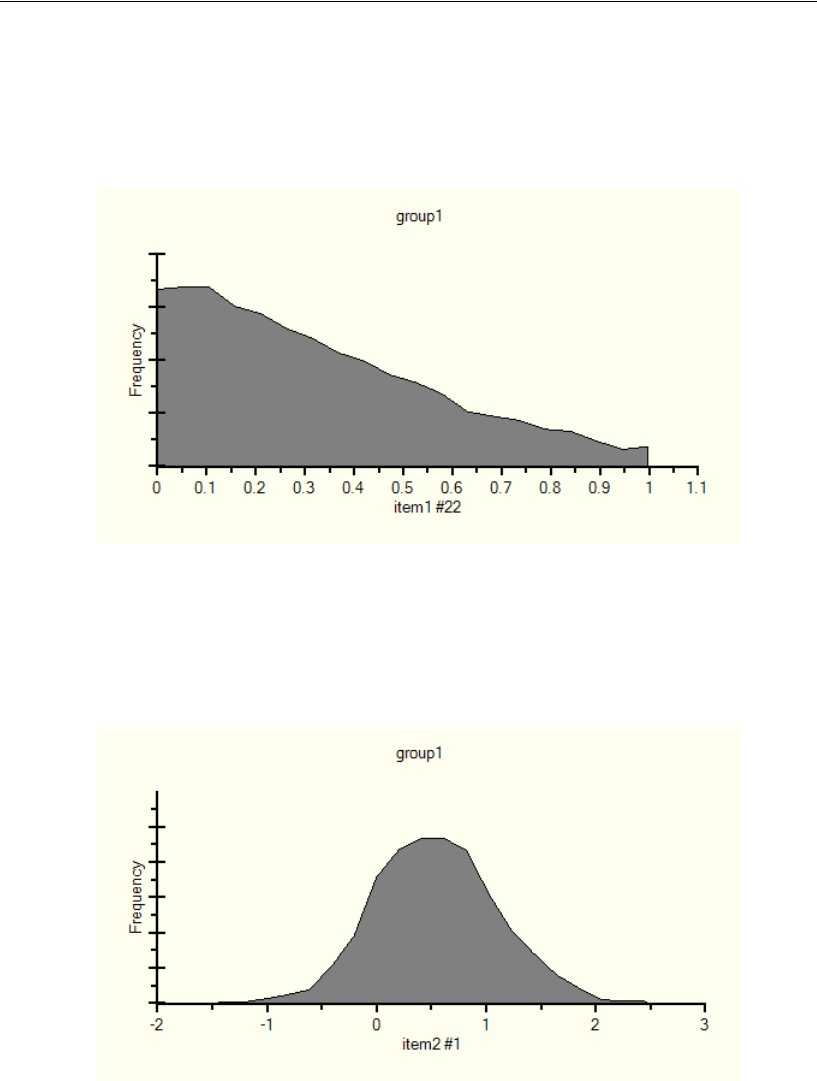
For another example of a posterior predictive distribution, select a missing value
like Person 1’s response to item2. After allowing MCMC sampling to proceed long
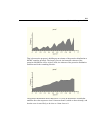
enough to get a good estimate of the posterior distribution, it looks like this:


