397
Bayesian Estimation
samples, one may ask whether there are enough of these samples to accurately estimate
the summary statistics, such as the posterior mean.
That question pertains to the second type of convergence, which we may call
convergence of posterior summaries. Convergence of posterior summaries is
complicated by the fact that the analysis samples are not independent but are actually
an autocorrelated time series. The 1001
th
sample is correlated with the 1000
th
, which,
in turn, is correlated with the 999
th
, and so on. These correlations are an inherent
feature of MCMC, and because of these correlations, the summary statistics from
5,500 (or whatever number of) analysis samples have more variability than they would
if the 5,500 samples had been independent. Nevertheless, as we continue to accumulate
more and more analysis samples, the posterior summaries gradually stabilize.
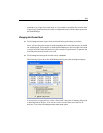
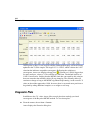
Amos provides several diagnostics that help you check convergence. Notice the
value 1.0083 on the toolbar of the Bayesian SEM window on p. 391. This is an overall
convergence statistic based on a measure suggested by Gelman, Carlin, Stern, and
Rubin (2004). Each time the screen refreshes, Amos updates the C.S. for each
parameter in the summary table; the C.S. value on the toolbar is the largest of the
individual C.S. values. By default, Amos judges the procedure to have converged if the
largest of the C.S. values is less than 1.002. By this standard, the maximum C.S. of
1.0083 is not small enough. Amos displays an unhappy face when the overall C.S.
is not small enough. The C.S. compares the variability within parts of the analysis
sample to the variability across these parts. A value of 1.000 represents perfect
convergence, and larger values indicate that the posterior summaries can be made more
precise by creating more analysis samples.
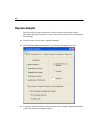
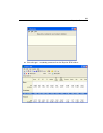
Clicking the
Pause Sampling button a second time instructs Amos to resume the
sampling process. You can also pause and resume sampling by choosing Pause
Sampling
from the Analyze menu, or by using the keyboard combination Ctrl+E. The
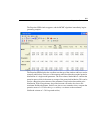
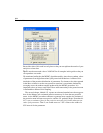
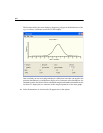
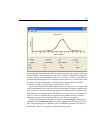
next figure shows the results after resuming the sampling for a while and pausing again.


