324
Example 22
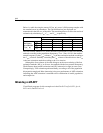
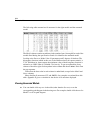
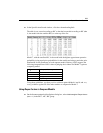
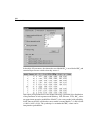
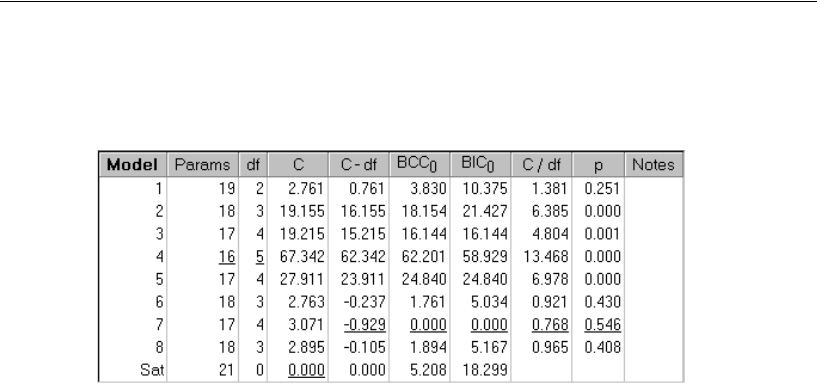
The following table summarizes fit measures for the eight models and the saturated
model:
The Model column contains an arbitrary index number from 1 through 8 for each of the
models fitted during the specification search. Sat identifies the saturated model.
Looking at the first row, Model 1 has 19 parameters and 2 degrees of freedom. The
discrepancy function (which in this case is the likelihood ratio chi-square statistic) is
2.761. Elsewhere in Amos output, the minimum value of the discrepancy function is
referred to as CMIN. Here it is labeled C for brevity. To get an explanation of any
column of the table, right-click anywhere in the column and choose
What’s This? from
the pop-up menu.
Notice that the best value in each column is underlined, except for the Model and
Notes columns.
Many familiar fit measures (CFI and RMSEA, for example) are omitted from this
table. Appendix E gives a rationale for the choice of fit measures displayed.
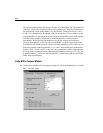
Viewing Generated Models
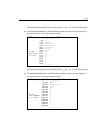
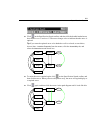
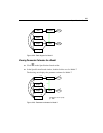
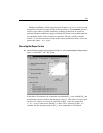
E You can double-click any row in the table (other than the Sat row) to see the
corresponding path diagram in the drawing area. For example, double-click the row for
Model 7 to see its path diagram.


