50
Example 2
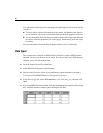
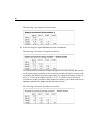
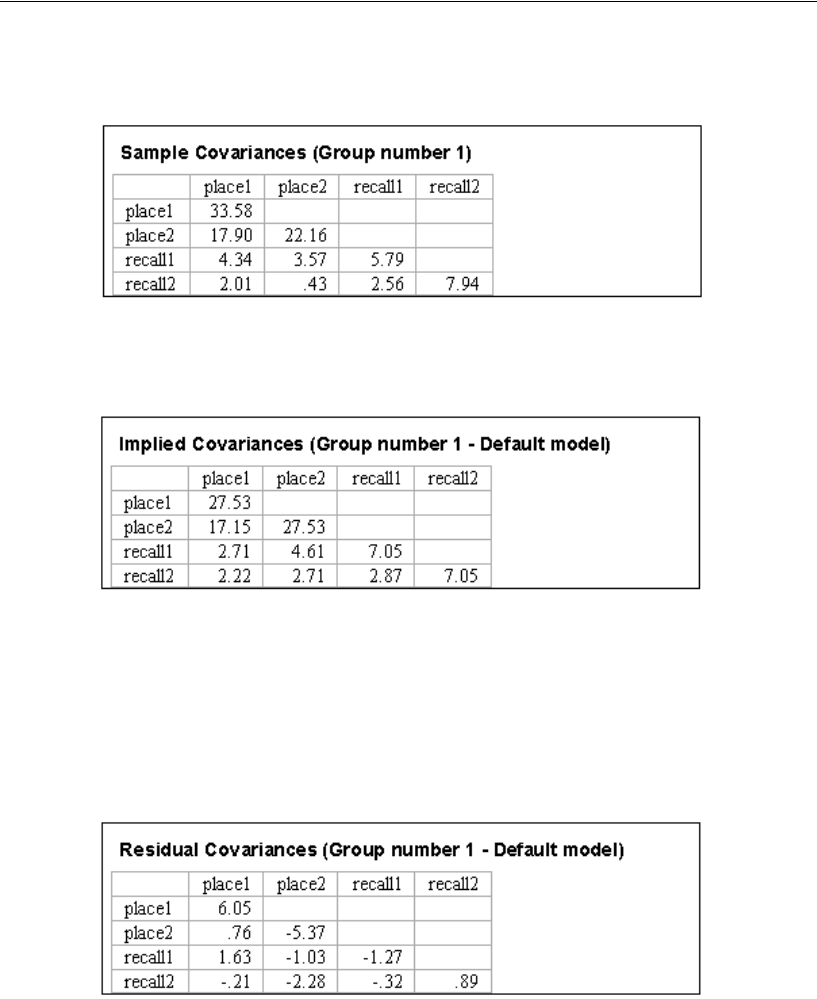
The following is the sample covariance matrix:
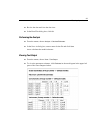
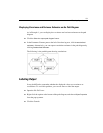
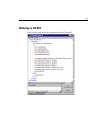
E In the tree diagram, expand Estimates and then click Matrices.
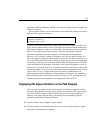
The following is the matrix of implied covariances:
Note the differences between the sample and implied covariance matrices. Because the
model imposes three constraints on the covariance structure, the implied variances and
covariances are different from the sample values. For example, the sample variance of
place1 is 33.58, but the implied variance is 27.53. To obtain a matrix of residual
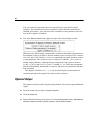
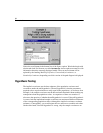
covariances (sample covariances minus implied covariances), put a check mark next to
Residual moments on the Output tab and repeat the analysis.
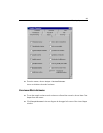
The following is the matrix of residual covariances:


