9
Tutorial: Getting Started with Amos Graphics
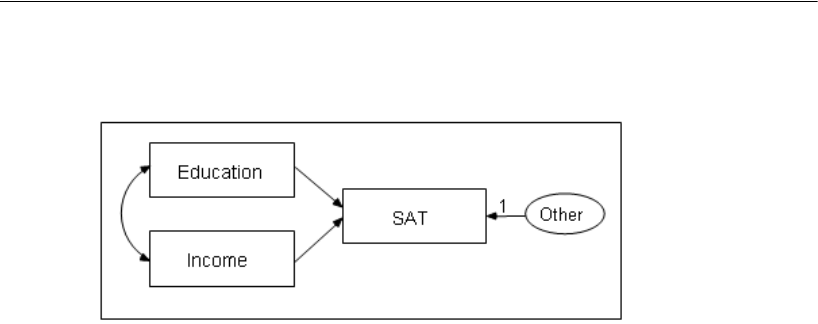
The following path diagram shows a model for these data:
This is a simple regression model where one observed variable, SAT, is predicted as a
linear combination of the other two observed variables, Education and Income. As with
nearly all empirical data, the prediction will not be perfect. The variable Other
represents variables other than Education and Income that affect SAT.
Each single-headed arrow represents a regression weight. The number
1 in the
figure specifies that Other must have a weight of 1 in the prediction of SAT. Some such
constraint must be imposed in order to make the model identified, and it is one of the
features of the model that must be communicated to Amos.
Launching Amos Graphics
You can launch Amos Graphics in any of the following ways:
Click Start on the Windows task bar, and choose All Programs > IBM SPSS
Statistics
> IBM SPSS Amos 21 > Amos Graphics.
Double-click any path diagram (*.amw).
Drag a path diagram (*.amw) file from Windows Explorer to the Amos Graphics
window.
Click Start on the Windows task bar, and choose All Programs > IBM SPSS
Statistics
> IBM SPSS Amos 21 > View Path Diagrams. Then double-click a path
diagram in the View Path Diagrams window.
From within SPSS Statistics, choose Analyze > IBM SPSS Amos from the menus.
