147
An Alternative to Analysis of Covariance
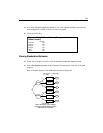
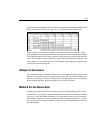
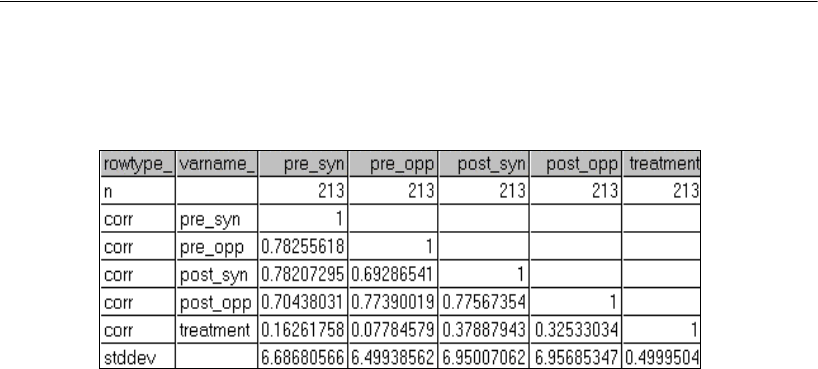
Correlations and standard deviations for the five measures are contained in the Microsoft
Excel workbook UserGuide.xls, in the Olss_all worksheet. Here is the dataset:
There are positive correlations between treatment and each of the posttests, which
indicates that the trained students did better on the posttests than the untrained students.
The correlations between treatment and each of the pretests are positive but relatively
small. This indicates that the control and experimental groups did about equally well
on the pretests. You would expect this, since students were randomly assigned to the
control and experimental groups.
Analysis of Covariance
To evaluate the effect of training on performance, one might consider carrying out an
analysis of covariance with one of the posttests as the criterion variable, and the two
pretests as covariates. In order for that analysis to be appropriate, both the synonyms
pretest and the opposites pretest would have to be perfectly reliable.
Model A for the Olsson Data
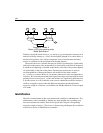
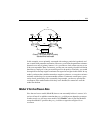
Consider the model for the Olsson data shown in the next path diagram. The model
asserts that pre_syn and pre_opp are both imperfect measures of an unobserved ability
called pre_verbal that might be thought of as verbal ability at the time of the pretest.
The unique variables eps1 and eps2 represent errors of measurement in pre_syn and
pre_opp, as well as any other influences on the two tests not represented elsewhere in
the path diagram.


