603
Measures of Fit
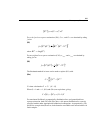
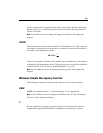
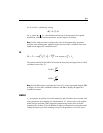
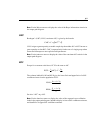
for , and is obtained by solving
for , where is the distribution function of the noncentral chi-squared
distribution with noncentrality parameter and d degrees of freedom.
Note: Use the \ncp text macro to display the value of the noncentrality parameter
estimate in the path diagram, \ncplo to display the lower 90% confidence limit, and
\ncphi for the upper 90% confidence limit.
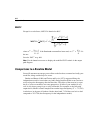
F0
is an estimate of .
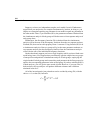
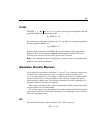
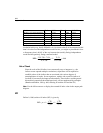
The columns labeled LO 90 and HI 90 contain the lower limit and upper limit of a 90%
confidence interval for .
Note: Use the \f0 text macro to display the value of in the output path diagram, \f0lo
to display its lower 90% confidence estimate, and \f0hi to display the upper 90%
confidence estimate.
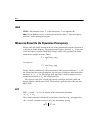
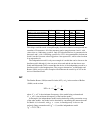
RMSEA
incorporates no penalty for model complexity and will tend to favor models with
many parameters. In comparing two nested models, will never favor the simpler
model. Steiger and Lind (1980) suggested compensating for the effect of model
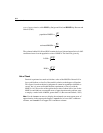
complexity by dividing by the number of degrees of freedom for testing the model.
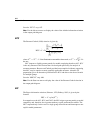
Taking the square root of the resulting ratio gives the population root mean square
δ
δ
U
(
)
05.,|
ˆ
=Φ dC
δ
δ
Φ x
δ
d,()
δ
F0 F
ˆ
0
max
C
ˆ
d–
n
-------------
0,
⎝⎠
⎛⎞
NCP
n
-----------== =
δ
n
--- F
0
=
F
0
n
L
δ
= 90 LO
n
U
δ
= 90 HI
F
ˆ
0
F
0
F
0
F
0


