120
Example 6
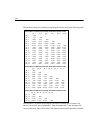
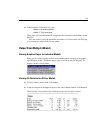
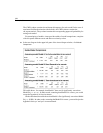
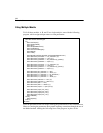
The CMIN column contains the minimum discrepancy for each model. In the case of
maximum likelihood estimation (the default), the CMIN column contains the
chi-square statistic. The p column contains the corresponding upper-tail probability for
testing each model.
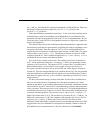
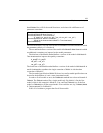
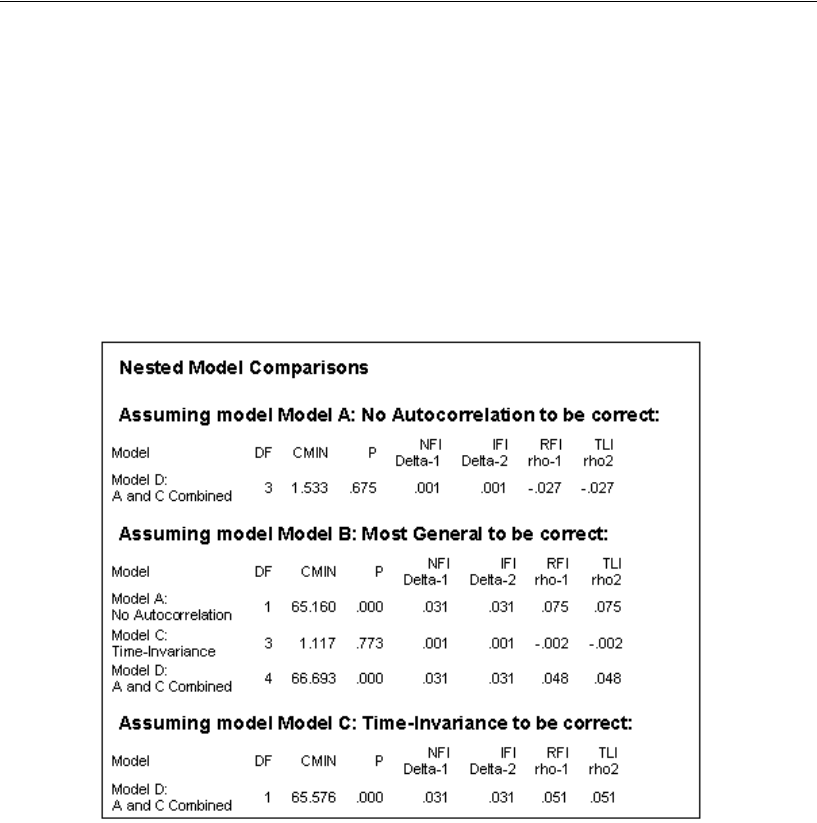
For nested pairs of models, Amos provides tables of model comparisons, complete
with chi-square difference tests and their associated p values.
E In the tree diagram in the upper left pane of the Amos Output window, click Model
Comparison
.
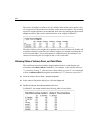
This table shows, for example, that Model C does not fit significantly worse than
Model B ( ). In other words, assuming that Model B is correct, you would
accept the hypothesis of time invariance.
On the other hand, the table shows that Model A fits significantly worse than Model
B ( ). In other words, assuming that Model B is correct, you would reject the
hypothesis that eps1 and eps3 are uncorrelated.
p 0.773=
p 0.000=


