326
Example 22
Using BCC to Compare Models
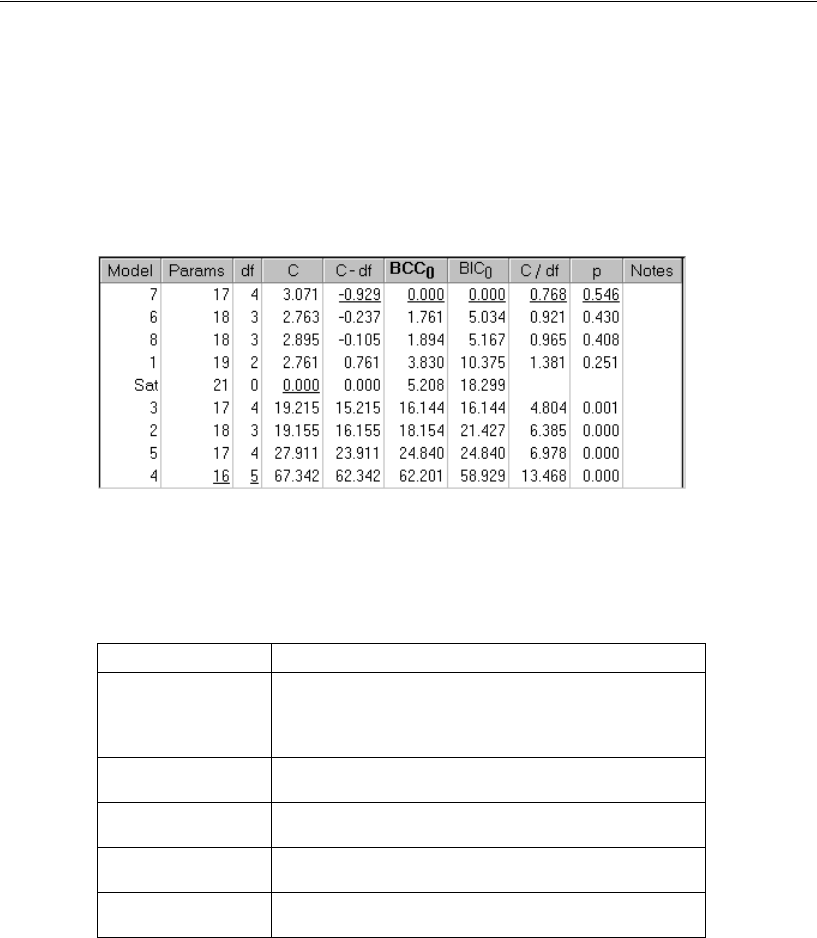
E In the Specification Search window, click the column heading BCC
0
.
The table sorts according to BCC so that the best model according to BCC (that is, the
model with the smallest BCC) is at the top of the list.
Based on a suggestion by Burnham and Anderson (1998), a constant has been added
to all the BCC values so that the smallest BCC value is 0. The 0 subscript on BCC
0
serves as a reminder of this rescaling. AIC (not shown in the above figure) and BIC
have been similarly rescaled. As a rough guideline, Burnham and Anderson (1998,
p. 128) suggest the following interpretation of AIC
0
. BCC
0
can be interpreted similarly.
Although Model 7 is estimated to be the best model according to Burnham and
Anderson’s guidelines, Models 6 and 8 should not be ruled out.
AIC
0
or BCC
0
Burnham and Anderson interpretation
0 – 2
There is no credible evidence that the model should be
ruled out as being the actual K-L best model for the
population of possible samples. (See Burnham and
Anderson for the definition of K-L best.)
2 – 4
There is weak evidence that the model is not the K-L
best model.
4 – 7
There is definite evidence that the model is not the K-L
best model.
7 – 10
There is strong evidence that the model is not the K-L
best model.
>10
There is very strong evidence that the model is not the
K-L best model.
