523
Mixture Modeling with Training Data
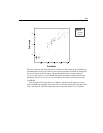
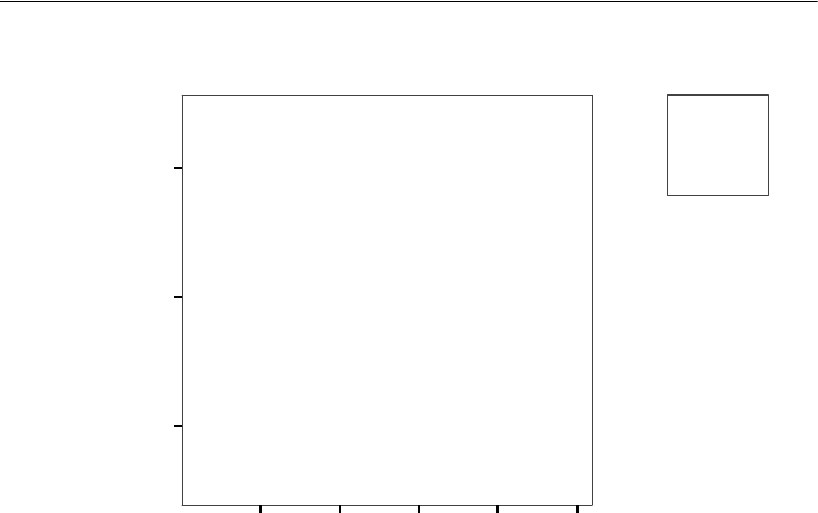
The setosa flowers are all by themselves in the lower left corner of the scatterplot. It
should therefore be easy for Amos to use PetalLength and PetalWidth to distinguish
the setosa flowers from the others. On the other hand, there is some overlap of
versicolor and virginica, so we should expect that sometimes it will be hard to tell
whether a flower is versicolor or virginica purely on the basis of PetalLength and
PetalWidth.
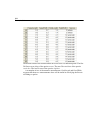
This example will not use the iris.sav dataset, which gives the species of every
flower. Instead, the example will use the iris3.sav dataset, which gives the species for
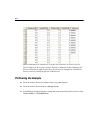
only a few flowers. The following figure shows a portion of the iris3.sav dataset.
$
setosa
%
versicolor
&
virginica
Species
0.5 1.0 1.5 2.0 2.5
PetalWidth
2.0
4.0
6.0
Pe
ta
l
L
e
n
g
th
$$
$
$
$
$
$
$
$
$$
$
$
$
$
$
$
$
$
$
$
$
$
$
$
$$
$
$
$$
$$
$
$
$
$
$
$
$
$$$
$
$
$
$
$
$
$
%
%
%
%
%
%
%
%
%
%
%
%
%
%
%
%
%
%
%
%
%
%
%
%
%
%
%
%
%
%
%
%
%
%
%%
%
%
%
%
%
%
%
%
%%%
%
%
%
&
&
&
&
&
&
&
&
&
&
&
&
&
&
&
&
&
&
&
&
&
&
&
&
&
&
&
&
&
&
&
&
&
&
&
&
&
&
&
&
&
&&
&
&
&
&
&
&
&


