143
Factor Analysis
E
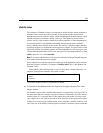
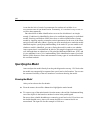
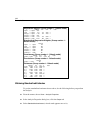
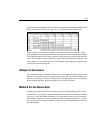
Also select Squared multiple correlations if you want squared multiple correlation for
each endogenous variable, as shown in the next graphic.
E Close the dialog box.
Viewing Standardized Estimates
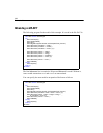
E In the Amos Graphics window, click the Show the output path diagram button.
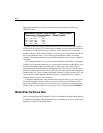
E Select Standardized estimates in the Parameter Formats panel at the left of the path
diagram.
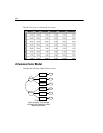
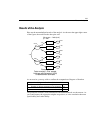
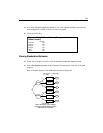
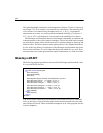
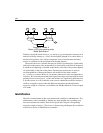
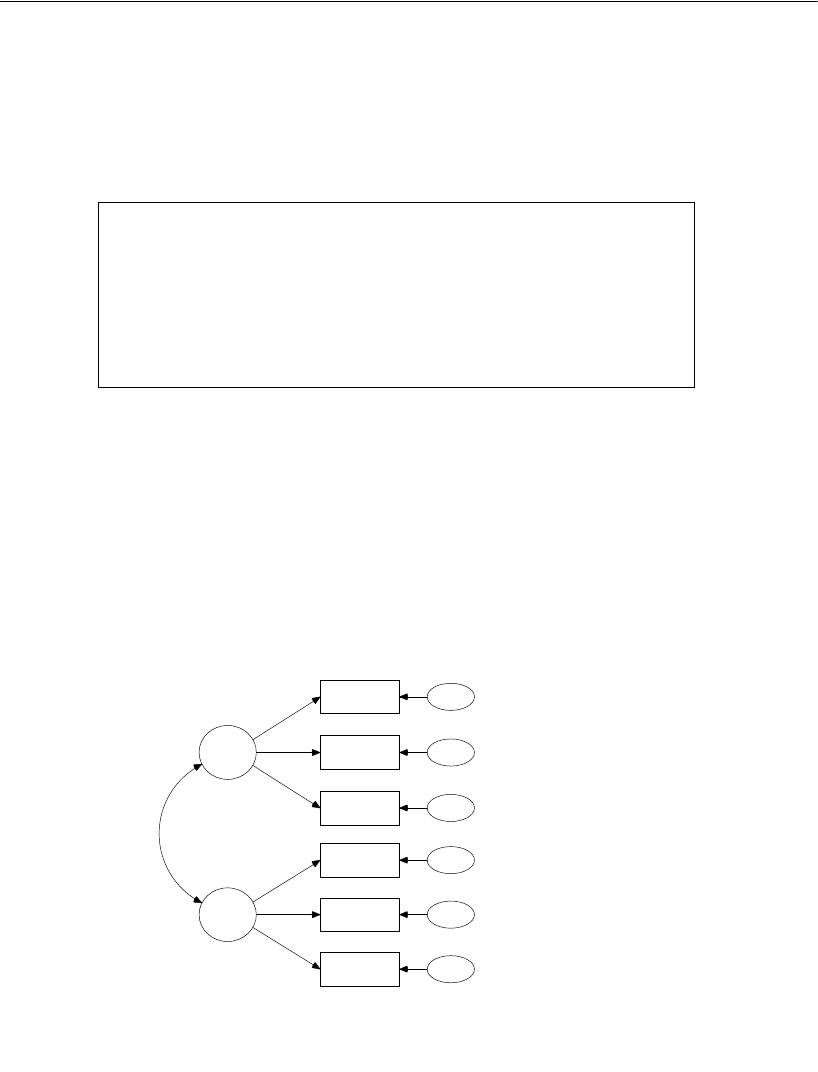
Here is the path diagram with standardized estimates displayed:
Squared Multiple Correlations: (Group number 1 -
Default model)
Estimate
wordmean
.708
sentence
.684
paragrap
.774
lozenges
.542
cubes
.428
visperc
.494
spatial
.49
visperc
.43
cubes
.54
lozenges
.71
wordmean
.77
paragrap
.68
sentence
err_v
err_c
err_l
err_p
err_s
err_w
verbal
.70
.65
.74
.88
.83
.84
.49
Example 8
Factor analysis: Girls' sample
Holzinger and Swineford (1939)
Standardized estimates
Chi-square = 7.853 (8 df)
p = .448


