604
Appendix C
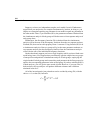
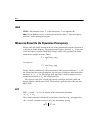
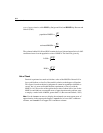
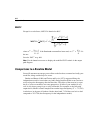
error of approximation, called RMS by Steiger and Lind, and RMSEA by Browne and
Cudeck (1993).
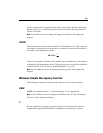
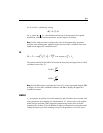
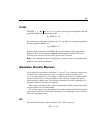
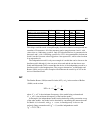
The columns labeled LO 90 and HI 90 contain the lower limit and upper limit of a 90%
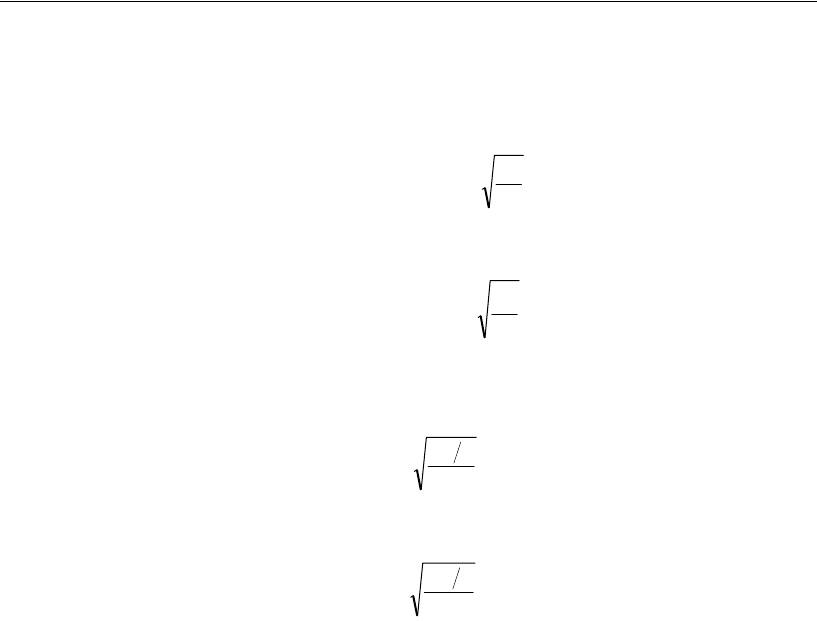
confidence interval on the population value of RMSEA. The limits are given by
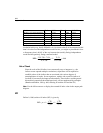
Rule of Thumb
Practical experience has made us feel that a value of the RMSEA of about 0.05 or
less would indicate a close fit of the model in relation to the degrees of freedom.
This figure is based on subjective judgment. It cannot be regarded as infallible or
correct, but it is more reasonable than the requirement of exact fit with the
RMSEA = 0.0. We are also of the opinion that a value of about 0.08 or less for the
RMSEA would indicate a reasonable error of approximation and would not want
to employ a model with a RMSEA greater than 0.1. (Browne and Cudeck, 1993)
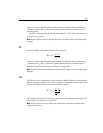
Note: Use the \rmsea text macro to display the estimated root mean square error of
approximation in the output path diagram, \rmsealo for its lower 90% confidence
estimate, and \rmseahi for its upper 90% confidence estimate.
d
F
0
RMSEA population =
d
F
0
ˆ
RMSEA estimated =
d
n
L
δ
= 90 LO
d
n
U
δ
= 90 HI


