64
Example 3
The usual t statistic for testing this null hypothesis is 0.59 ( ,
two-sided). The probability level associated with the t statistic is exact. The probability
level of 0.555 of the chi-square statistic is off, owing to the fact that it does not have an
exact chi-square distribution in finite samples. Even so, the probability level of 0.555
is not bad.
Here is an interesting question: If you use the probability level displayed by Amos
to test the null hypothesis at either the 0.05 or 0.01 level, then what is the actual
probability of rejecting a true null hypothesis? In the case of the present null
hypothesis, this question has an answer, although the answer depends on the sample
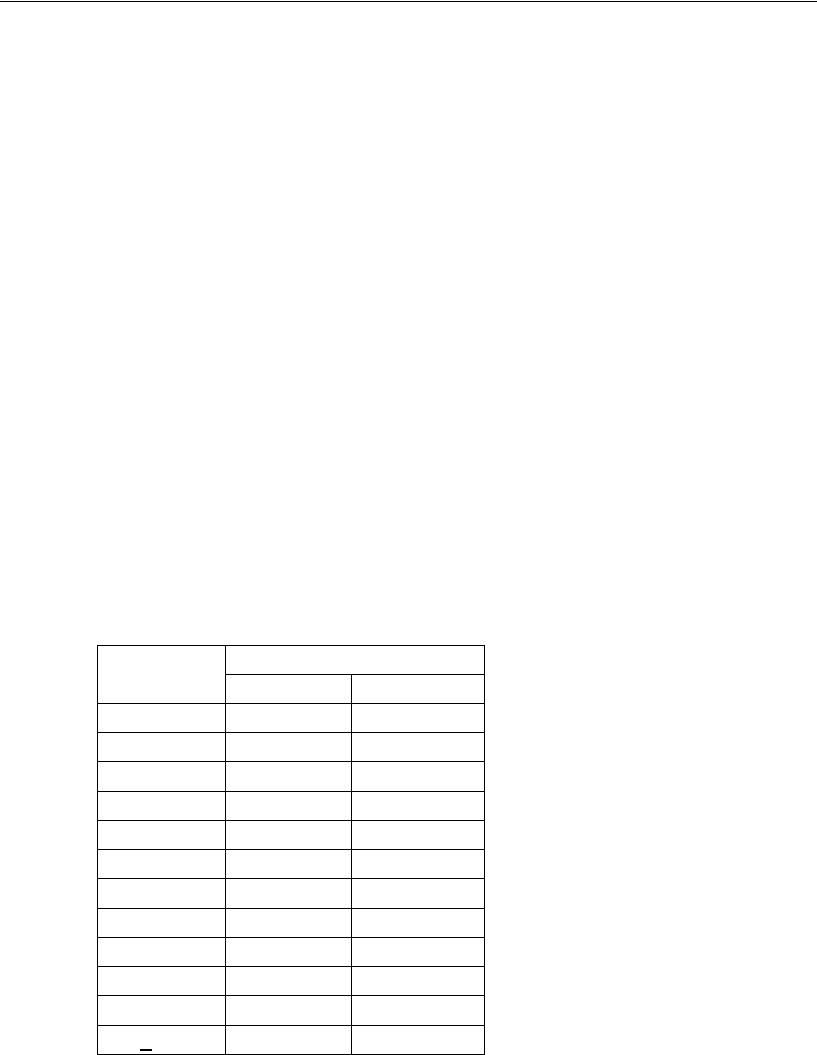
size. The second column in the next table shows, for several sample sizes, the real
probability of a Type I error when using Amos to test the null hypothesis of zero
correlation at the 0.05 level. The third column shows the real probability of a Type I
error if you use a significance level of 0.01. The table shows that the bigger the sample
size, the closer the true significance level is to what it is supposed to be. It’s too bad
that such a table cannot be constructed for every hypothesis that Amos can be used to
test. However, this much can be said about any such table: Moving from top to bottom,
the numbers in the 0.05 column would approach 0.05, and the numbers in the 0.01
column would approach 0.01. This is what is meant when it is said that hypothesis tests
based on maximum likelihood theory are asymptotically correct.
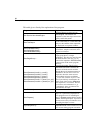
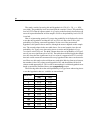
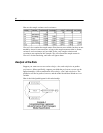
The following table shows the actual probability of a Type I error when using Amos
to test the hypothesis that two variables are uncorrelated:
Sample Size
Nominal Significance Level
0.05 0.01
3 0.250 0.122
4 0.150 0.056
5 0.115 0.038
10 0.073 0.018
20 0.060 0.013
30 0.056 0.012
40 0.055 0.012
50 0.054 0.011
100 0.052 0.011
150 0.051 0.010
200 0.051 0.010
>
500 0.050 0.010
df 38=
p 0.56=


