180
Example 11
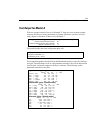
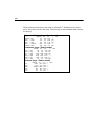
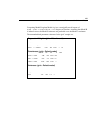
These parameter estimates are the same as in Example 7. Standard errors, critical
ratios, and p values are also the same. The following are the unstandardized estimates
for the boys:
Regression Weights: (boys - Default model)
Estimate S.E. C.R. P Label
academic
<---
GPA .021 .003 6.927 ***
attract <---
height .019 .010 1.967 .049
attract <---
weight -.003 .001 -2.484 .013
attract <---
rating .095 .030 3.150 .002
attract <---
academic
1.386 .315 4.398 ***
academic
<---
attract .063 .059 1.071 .284
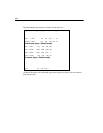
Covariances: (boys - Default model)
Estimate S.E. C.R. P Label
GPA <-->
rating
.507
.274 1.850 .064
height
<-->
rating
.198
.230 .860 .390
GPA <-->
weight
-15.645
6.899 -2.268 .023
GPA <-->
height
-1.508
.961 -1.569 .117
height
<-->
weight
42.091
6.455 6.521 ***
weight
<-->
rating
-4.226
1.662 -2.543 .011
error1
<-->
error2
-.010
.011 -.898 .369
Variances: (boys - Default model)
Estimate S.E. C.R. P Label
GPA
16.243
1.600 10.149 ***
height
11.572
1.140 10.149 ***
weight
588.605
57.996 10.149 ***
rating
.936
.092 10.149 ***
error1
.015
.002 7.571 ***
error2
.164
.016 10.149 ***


