


200
Example 12
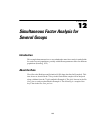
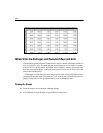
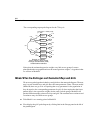
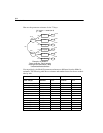
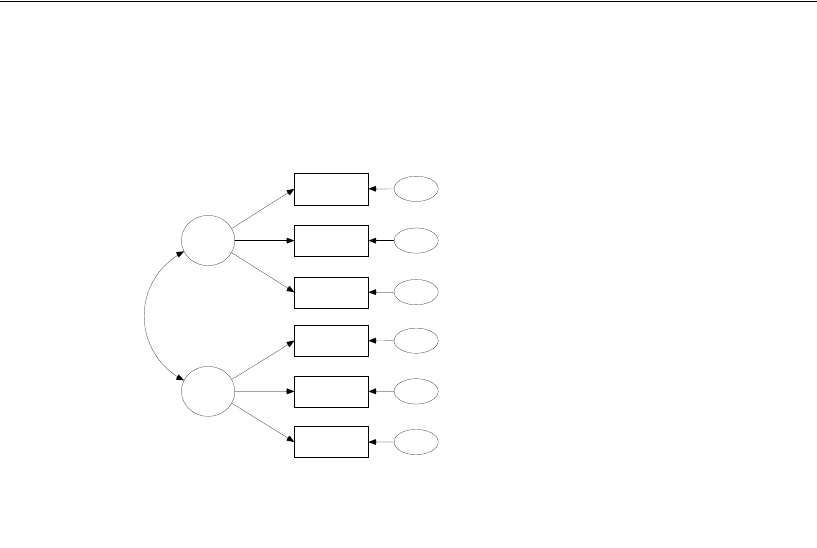
The corresponding output path diagram for the 72 boys is:
Notice that the estimated regression weights vary little across groups. It seems
plausible that the two populations have the same regression weights—a hypothesis that
we will test in Model B.
Model B for the Holzinger and Swineford Boys and Girls
We now accept the hypothesis that boys and girls have the same path diagram. The next
step is to ask whether boys and girls have the same parameter values. The next model
(Model B) does not go as far as requiring that every parameter for the population of
boys be equal to the corresponding parameter for girls. It does require that the factor
pattern (that is, the regression weights) be the same for both groups. Model B still
permits different unique variances for boys and girls. The common factor variances and
covariances may also differ across groups.
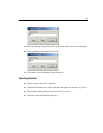
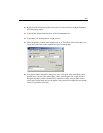
E Take Model A as a starting point for Model B.
E First, display the girls’ path diagram by clicking Girls in the Groups panel at the left of
the path diagram.
16.06
spatial
visperc
cubes
lozenges
wordmean
paragrap
sentence
31.57
err_v
15.69
err_c
36.53
err_l
2.36
err_p
6.04
err_s
19.70
err_w
6.90
verbal
1.00
.45
1.51
1.00
1.28
2.29
1
1
1
1
1
1
6.84
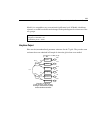
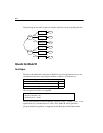
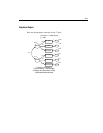
Example 12: Model A
Factor analysis: Boys' sample
Holzinger and Swineford (1939)
Unstandardized estimates
Chi-square = 16.480 (16 df)
p = .420