


582
Example 37
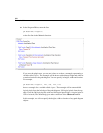
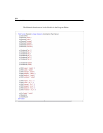
E Enter the following lines so that the plugin will draw the 12 single-headed arrows:
pd.Path("visperc", "spatial", 1)
pd.Path("cubes", "spatial")
pd.Path("lozenges", "spatial")
pd.Path("paragrap", "verbal", 1)
pd.Path("sentence", "verbal")
pd.Path("wordmean", "verbal")
pd.Path("visperc", "err_v", 1)
pd.Path("cubes", "err_c", 1)
pd.Path("lozenges", "err_l", 1)
pd.Path("paragrap", "err_p", 1)
pd.Path("sentence", "err_s", 1)
pd.Path("wordmean", "err_w", 1)
Notice that in some of the lines above, the Path method has a third argument that is set
equal to 1. This is how you fix a regression weight to a constant value of 1. See the
online help for other variations of the Path method.
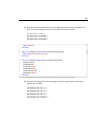
E Enter the following line so that the plugin will draw the double-headed arrow:
pd.Cov("spatial", "verbal")
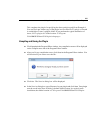
E Enter the following line to reposition the objects in the path diagram so as to improve
its appearance:
pd.Reposition()
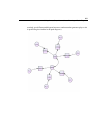
As mentioned above, the simple forms of the Observed, Unobserved and Caption
methods that are used in this example place objects at random positions in the path
diagram. The Reposition method attempts to make the path diagram look better by
rearranging objects. The Reposition method does not produce path diagrams of
presentation quality. Far from it, in fact. On the other hand, Reposition usually
improves a path diagram’s appearance substantially. In order to get objects in the path
diagram sized and positioned exactly the way you want, you can use one of the
following approaches.