289
More about Missing Data
62, is about 4.21. Although the standard errors just mentioned are only approximations,
they still provide a rough basis for comparison. In the case of the young subjects, using
the information contained in the v_short scores reduces the standard error of the
estimated vocab mean by about 21%. In the case of the old subjects, the standard error
was reduced by about 49%.
Another way to evaluate the additional information that can be attributed to the
v_short scores is by evaluating the sample size requirements. Suppose you did not use
the information in the v_short scores. How many more young examinees would have
to take the vocab test to reduce the standard error of its mean by 21%? Likewise, how
many more old examinees would have to take the vocab test to reduce the standard
error of its mean by 49%? The answer is that, because the standard error of the mean
is inversely proportional to the square root of the sample size, it would require about
1.6 times as many young subjects and about 3.8 times as many old subjects. That is, it
would require about 16 young subjects and 38 old subjects taking the vocab test,
instead of 10 young and 10 old subjects taking both tests, and 30 young and 30 old
subjects taking the short test alone. Of course, this calculation treats the estimated
standard errors as though they were exact standard errors, and so it gives only a rough
idea of how much is gained by using scores on the v_short test.
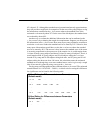
Do the young and old populations have different mean vocab scores? The estimated
mean difference is 8.110 (65.001 – 56.891). A critical ratio for testing this difference
for significance can be found in the following table:
Critical Ratios for Differences between Parameters
(Default model)
m1_yng m1_old par_3 par_4 par_5 par_6 par_7
m1_yng .000
m1_old 2.901 .000
par_3 -2.702 -3.581 .000
par_4 -36.269 -25.286 -2.864 .000
par_5 -2.847 -3.722 -.111 2.697 .000
par_6 -25.448 -30.012 -2.628 2.535 -2.462 .000
par_7 1.028 .712 2.806 2.939 1.912 2.858 .000
par_8 -10.658 -12.123 -2.934 2.095 -1.725 1.514 -2.877
par_9 1.551 1.334 2.136 2.859 2.804 2.803 .699
par_10 -15.314 -16.616 -2.452 1.121 -3.023 .300 -2.817
Critical Ratios for Differences between Parameters
(Default model)
par_8 par_9 par_10
par_8 .000
par_9 2.650 .000
par_10 -1.077 -2.884 .000


