184
Example 11
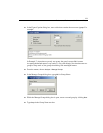
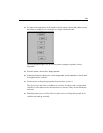
E Repeat this until you have named every regression weight. Always make sure to select
(put a check mark next to)
All groups.
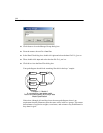
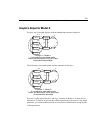
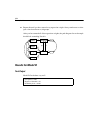
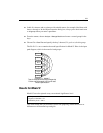
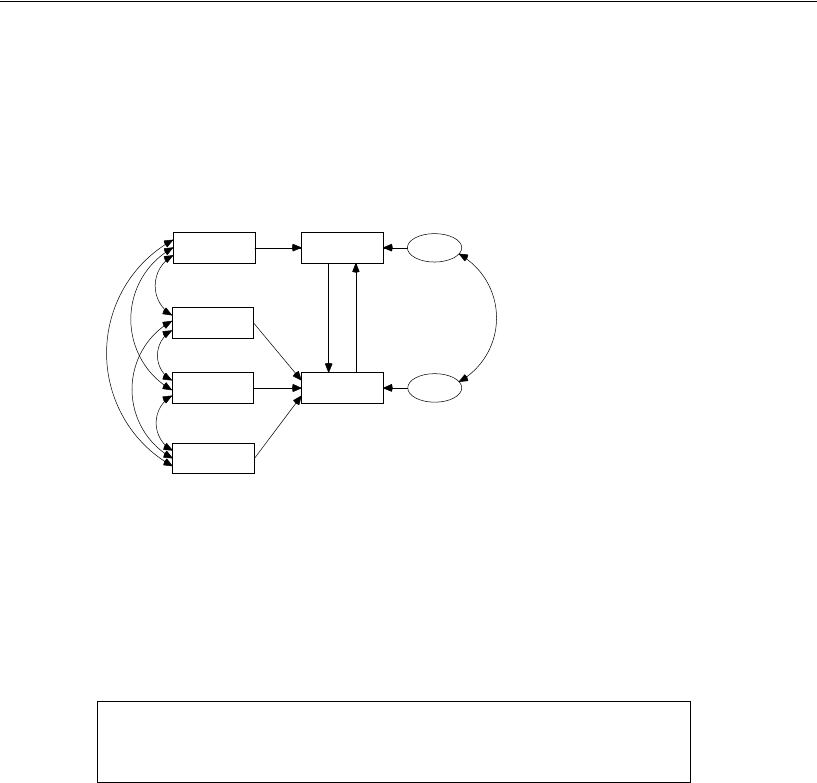
After you have named all of the regression weights, the path diagram for each sample
should look something like this:
Results for Model B
Text Output
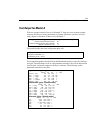
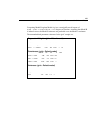
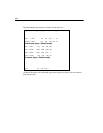
Model B fits the data very well.
Chi-square = 9.493
Degrees of freedom = 10
Probability level = 0.486
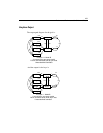
GPA
height
rating
weight
academic
attract
p1
p
3
p4
p
5
error1
error2
1
1
p6 p2


