340
Example 22
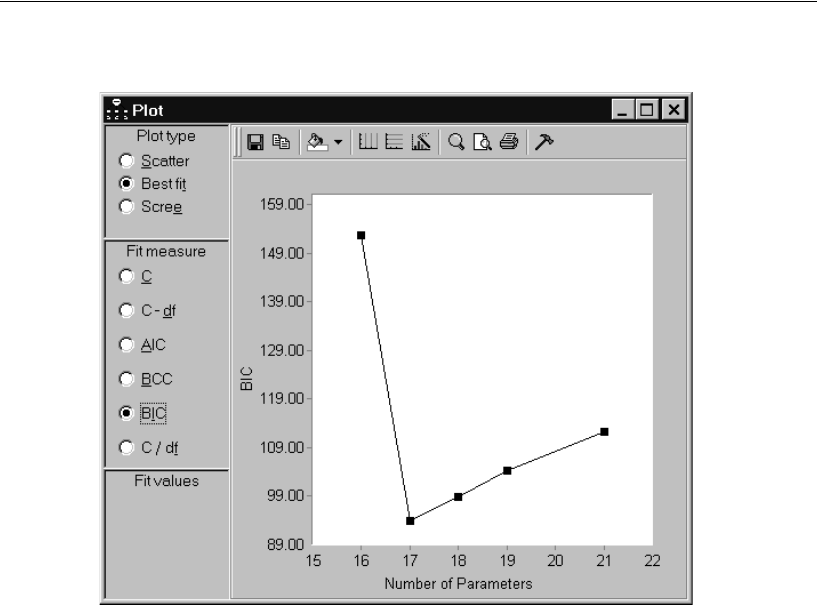
BIC is the measure among C, C – df, AIC, BCC, and BIC that imposes the greatest
penalty for complexity. The high penalty for complexity is reflected in the steep
positive slope of the graph as the number of parameters increases beyond 17. The graph
makes it clear that, according to BIC, the best 17-parameter model is superior to any
other candidate model.
Notice that clicking different fit measures changes the vertical axis of the best-fit
graph and changes the shape of the configuration of points.
1
However, the identity of
each point is preserved. The best 16-parameter model is always Model 4, the best 17-
parameter model is always Model 7, and so on. This is because, for a fixed number of
parameters, the rank order of models is the same for every fit measure.
Viewing the Scree Plot for C
E In the Plot window, select Scree in the Plot type group.
1 The saturated model is missing from the C / df graph because C / df is not defined for the saturated model.
