336
Example 22
Viewing the Line Representing Constant C – df
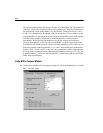
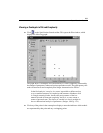
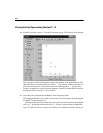
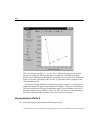
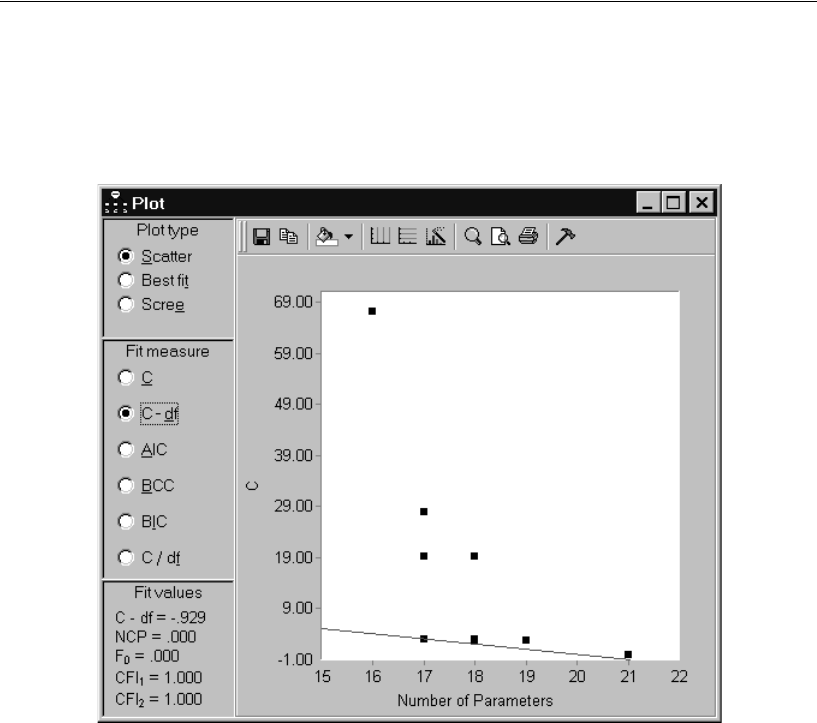
E In the Plot window, select C – df in the Fit measure group. This displays the following:
The scatterplot remains unchanged except for the position of the adjustable line. The
adjustable line now contains points for which C – df is constant. Whereas the line was
previously horizontal, it is now tilted downward, indicating that C – df gives some
weight to complexity in assessing model adequacy. Initially, the adjustable line passes
through the point for which C – df is smallest.
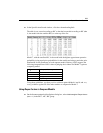
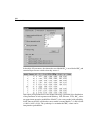
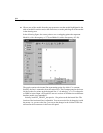
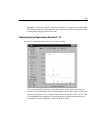
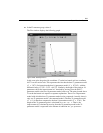
E Click that point, and then choose Model 7 from the pop-up menu.
This highlights Model 7 in the table of fit measures and also displays the path diagram
for Model 7 in the drawing area.
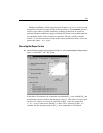
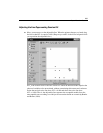
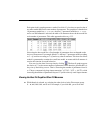
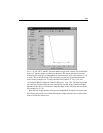
The panel in the lower left corner shows the value of some fit measures that depend
only on C – df and that are therefore, like C – df itself, constant along the adjustable
line. CFI
1
and CFI
2
are two versions of CFI that use two different baseline models (see


