601
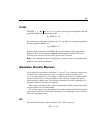
Measures of Fit
Our opinion...is that this null hypothesis [of perfect fit] is implausible and that it
does not help much to know whether or not the statistical test has been able to
detect that it is false. (Browne and Mels, 1992, p. 78).
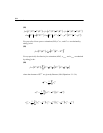
See also “PCLOSE” on p. 605.
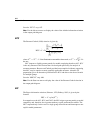
Note: Use the \p text macro for displaying this p value in the output path diagram.
CMIN/DF
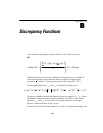
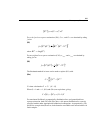
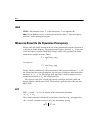
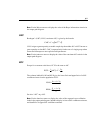
CMIN/DF is the minimum discrepancy, , (see Appendix B) divided by its degrees
of freedom.
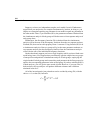
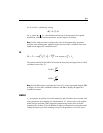
Several writers have suggested the use of this ratio as a measure of fit. For every
estimation criterion except for
ULS and SLS, the ratio should be close to 1 for correct
models. The trouble is that it isn’t clear how far from 1 you should let the ratio get
before concluding that a model is unsatisfactory.
Rules of Thumb
...Wheaton et al. (1977) suggest that the researcher also compute a relative chi-
square ( ).... They suggest a ratio of approximately five or less ‘as
beginning to be reasonable.’ In our experience, however, to degrees of
freedom ratios in the range of 2 to 1 or 3 to 1 are indicative of an acceptable fit
between the hypothetical model and the sample data. (Carmines and McIver,
1981, p. 80)
...different researchers have recommended using ratios as low as 2 or as high as
5 to indicate a reasonable fit. (Marsh and Hocevar, 1985).
...it seems clear that a ratio > 2.00 represents an inadequate fit. (Byrne,
1989, p. 55).
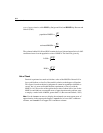
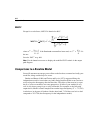
Note: Use the \cmindf text macro to display the value of CMIN/DF in the output path
diagram.
C
ˆ
d
C
ˆ
χ
2
df⁄
χ
2
χ
2
df⁄


