


1152700 • Issue 1 • February 2001 • Section 2 Operation and Maintenance
Page 2-175
2000, ADC Telecommunications, Inc.
DLP-733
Page 1 of 2
SET / RETRIEVE FE1 FRS PERFORMANCE MONITORING STATISTICS
Summary: This procedure describes the steps required to successfully retrieve the performance
monitoring statistics for specified FE1 FRS interface ports within a Cellworx STN network.
Information retrieved is on a per node and per port basis. This procedure assumes the user has
already accessed the GUI and initiated the Performance Monitoring-Selection window per NTP-
008.
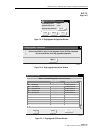
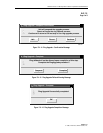
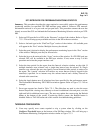
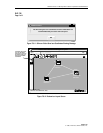
1. Select an NE from the list of NEs in the “Resource” section of the window. Refer to Figure
733-1. This will bring up any available card slots in the NE in the next window.
2. Select a slot/card type in the “Slot/Card Type” section of the window. All available ports
will appear in the “Port” window. Multiple slots may be selected.
3. Select the port(s) desired to display the performance monitoring layers in the “Port” section
of the window. Multiple ports may be selected also.
4. Select the layer to be retrieved in the “Layer” section of the window. If a FE1 FRS card was
selected, DS1 will be available in the PM layer window. If not, return to step 2 of this
procedure and select the proper interface card.
5. Select the time period for the report from the Interval selection window on the right. If
multiple interfaces were selected, only a single time interval may be selected. If a single
interface was selected, the user may specify several historical time periods to retrieve for
the report. The “current” selection will retrieve any errors that are actively logged for the
interface(s) specified. In no instance may the current interval and a history interval be
selected at the same time.
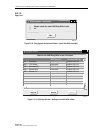
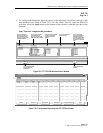
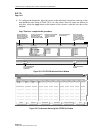
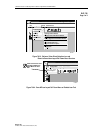
6. Select the Apply button once all selections have been specified for the performance report.
The Performance Monitoring- FE1 FRS Port window appears. Refer to Figure 733-2 for an
example.
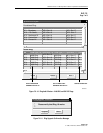
7. Error types reported are listed in Table 733-1. The slider bars are used to view the errors
that are beyond the viewing area, either up or down for additional slots and ports, or to the
right and left for additional error types. The user may update the counts using the Refresh
button at the bottom of the screen. If retrieving history counts, the Refresh button is
disabled. Refer to TAP-100 at the end of this section for troubleshooting guidelines.
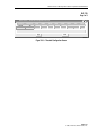
THRESHOLD CONFIGURATION
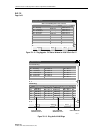
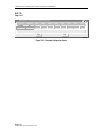
8. Users may specify error counts required to trip a system alarm by clicking on the
Configure Thresholds button at the bottom of the PM Data window. This will bring up a
Performance Monitoring Configuration window similar to Figure 733-3.