


Chapter 12: Monitoring Subscriber Connections
Avidia System Configuration and Management User Manual 275
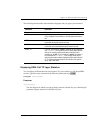
Examples
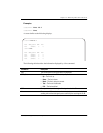
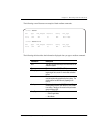
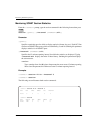
::idsl=> perf 5.1
::idsl=> perf 5.1 -interval all -day
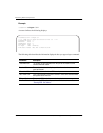
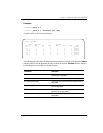
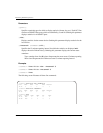
A screen similar to the following displays.
The following table describes the information displayed after you type a perf command.
Network
indicates statistics for the upstream direction, toward the network.
Customer indicates statistics
for the downstream direction, toward the customer.
Information Description
Port The slot number and port number for which current
performance is displayed.
Node ID The node for which current performance is displayed.
BEs (Network/Customer) The number of block errors since this interval (hour or
day) began.
ESs (Network/Customer) The number of errored seconds since this interval
(hour or day) began.
SESs (Network/Customer) The number of severely errored seconds since this
interval (hour or day) began.
Mode The performance monitoring mode (path or
segmented).
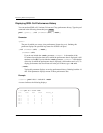
::idsl=> perf 4.1
Node Network Customer
Port Id BEs ESs SESs BEs ESs SESs Mode
4.1 0 1 1 0 0 0 0 path(1)
4.1 1 0 0 0 0 0 0 path(1)
4.1 2 0 0 0 0 0 0 path(1)
4.1 3 0 0 0 0 0 0 path(1)
4.1 4 0 0 0 0 0 0 path(1)
4.1 5 0 0 0 0 0 0 path(1)
4.1 6 0 0 0 0 0 0 path(1)