


About NetSight Element Manager 2-9
Overview of NetSight Element Manager
Map Views
Map View windows in NetSight Element Manager provide a third — and perhaps the
most flexible — means for viewing information about your network. Using maps, you can
create a visual representation of your network: grouping devices by location rather than
function, and using a variety of graphical tools (including bitmap backgrounds and drawn
objects) to represent connections and other pertinent information about the physical
structure of your network. Maps also support Microsoft’s OLE (Object Linking and
Embedding), which can be used to link or embed data created via other applications into a
map document.
NetSight Element Manager’s map feature allows you to create a three-dimensional
representation of your network by allowing you to show not only relationships between
devices, but relationships between groups of devices. Individual Map Views can be linked
to other Map Views to create a hierarchical structure which is graphically represented in
the Map View workspace, again via the Microsoft standard tree control. The overall status
of each individual map is also displayed in the workspace; for related maps, each map’s
status includes the status of any submaps with which it is associated. These status reports
are propagated up the hierarchy, whether individual maps are closed or open — giving
you a bird’s-eye view of your network status at all times.
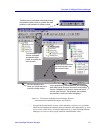
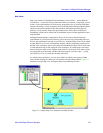
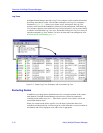
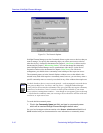
As with the other workspaces, you can create folders in which to nest groups of Map
icons; double-clicking on a Map icon will open the associated Map window. Figure 2-5
illustrates a sample Map View workspace and an associated Map window.
Figure 2-5. Sample Map View Workspace and Map Window