


23-43
ATM Switch Router Software Configuration Guide
OL-7396-01
Chapter 23 Configuring the ATM Traffic-Shaping Carrier Module
Traffic-shaping Granularity Tables
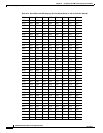
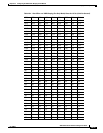
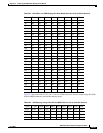
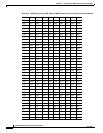
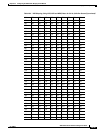
Table 23-5 shows the DS3, E3, E1 and T1 rates for VBR connections that are shaped using their PCR,
SCR and MBS parameters (the default shaping mode).
325 324 323 322 321 320 319 318 317
316 315 314 313 312 311 310 309 308
307 306 305 304 303 302 301 300 299
298 297 296 295 294 293 292 291 290
289 288 287 286 285 284 283 282 281
280 279 278 277 276 275 274 273 272
271 270 269 268 267 266 265 264 263
262 261 260 259 258 257 256 255 254
253 252 251 250 249 248 247 246 245
244 243 242 241 240 239 238 237 236
235 234 233 232 231 230 229 228 227
226 225 224 223 222 221 220 219 218
217 216 215 214 213 212 211 210 209
208 207 206 205 204 203 202 201 200
199 198 197 196 195 194 193 192 191
190 189 188 187 186 185 184 183 182
181 180 179 178 177 176 175 174 173
172 171 170 169 168 167 166 165 164
163 162 161 160 159 158 157 156 155
154 153 152 151 150 149 148 147 146
145 144 143 142 141 140 139 138 137
136 135 134 133 132 131 130 129 128
127 126 125 124 123 122 121 120 119
118 117 116 115 114 113 112 111 110
109 108 107 106 105 104 103 102 101
1009998979695949392
91 90 89 88 87
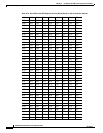
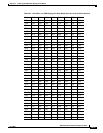
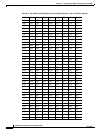
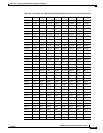
Table 23-4 Best-Effort and VBR Shaping (Pcr-Only Mode) Rates for OC-3c (Cells Per Second)
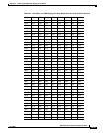
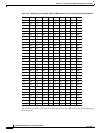
Table 23-5 VBR Shaping (Using PCR, SCR and MBS) Rates for OC-3c (Cells Per Second)
354017 177009 118006 88505 70804 59003 50574 44253 39336 35402
32184 29502 27233 25287 23602 22127 20825 19668 18633 17701
16858 16092 15393 14751 14161 13617 13112 12644 12208 11801
11420 11064 10728 10413 10115 9834 9569 9317 9078 8851
8635 8429 8233 8046 7868 7697 7533 7376 7225 7081