


Chapter 6: Basic Function Graphing 105
06BASFUN.DOC TI-89/TI-92 Plus: Basic Function Graphing (English) Susan Gullord Revised: 02/23/01 4:09 PM Printed: 02/23/01 4:18 PM Page 105 of 22
Chapter 6:
Basic Function Graphing
Preview of Basic Function Graphing................................................... 106
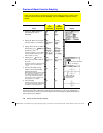
Overview of Steps in Graphing Functions.......................................... 107
Setting the Graph Mode......................................................................... 108
Defining Functions for Graphing ......................................................... 109
Selecting Functions to Graph............................................................... 111
Setting the Display Style for a Function.............................................. 112
Defining the Viewing Window.............................................................. 113
Changing the Graph Format ................................................................. 114
Graphing the Selected Functions......................................................... 115
Displaying Coordinates with the Free-Moving Cursor...................... 116
Tracing a Function................................................................................. 117
Using Zooms to Explore a Graph......................................................... 119
Using Math Tools to Analyze Functions ............................................. 122
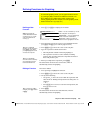
This chapter describes the steps used to display and explore a
graph. Before using this chapter, you should be familiar with
Chapter 2.
Although this chapter describes how to graph
y(x)
functions, the
basic steps apply to all graphing modes. Later chapters give
specific information about the other graphing modes.
6
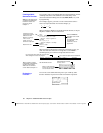
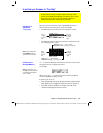
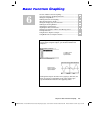
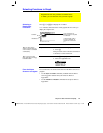
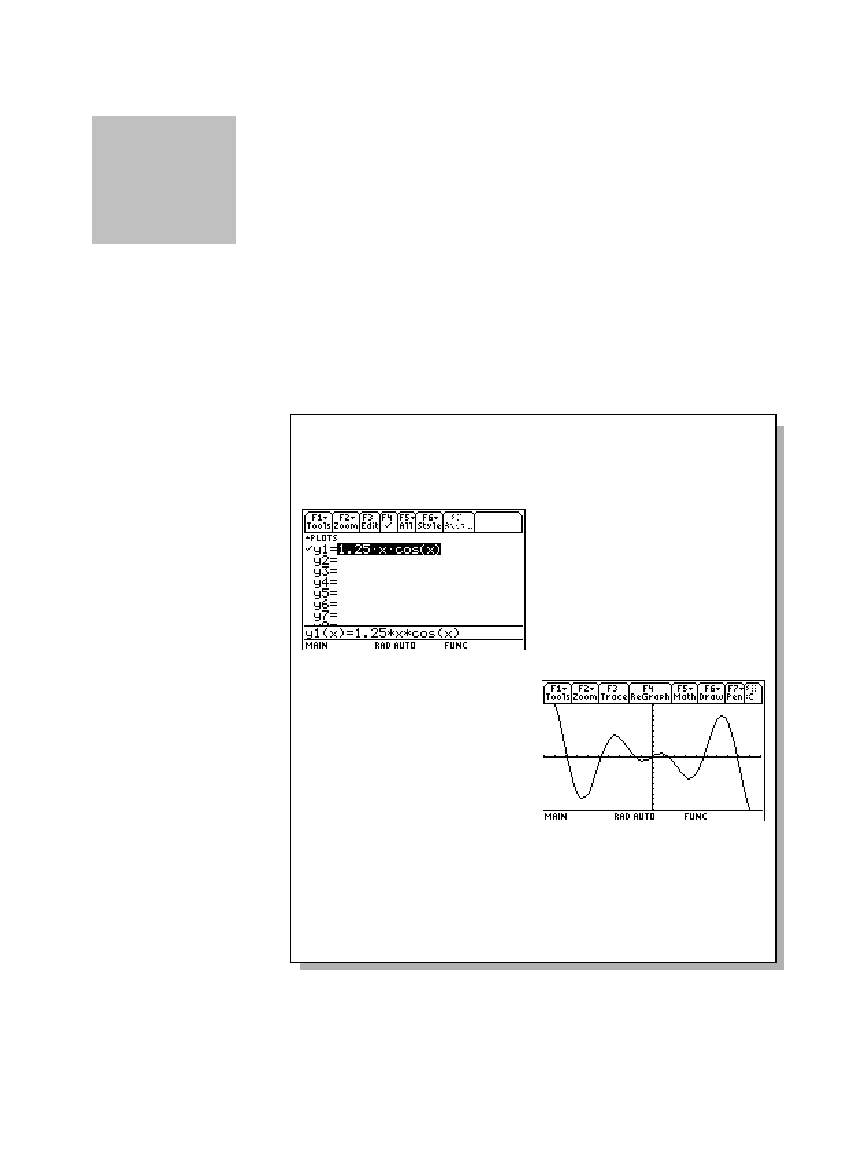
Y= Editor shows
an algebraic
representation.
Graph screen
shows a graphic
representation.