


440 Appendix A: Functions and Instructions
8992APPA.DOC TI-89 / TI-92 Plus: Appendix A (US English) Susan Gullord Revised: 02/23/01 1:48 PM Printed: 02/23/01 2:21 PM Page 440 of 132
DrawPol
CATALOG
DrawPol
expression
[
,
qmin
] [
,
qmax
] [
,
qstep
]
Draws the polar graph of
expression
, using
q
as the independent variable.
Defaults for
q
min
,
q
max
, and
q
step
are the
current settings for the Window variables
q
min
,
q
max
, and
q
step
. Specifying values does
not alter the window settings. If the current
graphing mode is not polar, these three
arguments are required.
Note: Regraphing erases all drawn items.
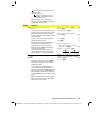
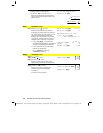
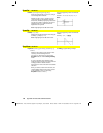
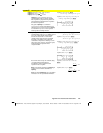
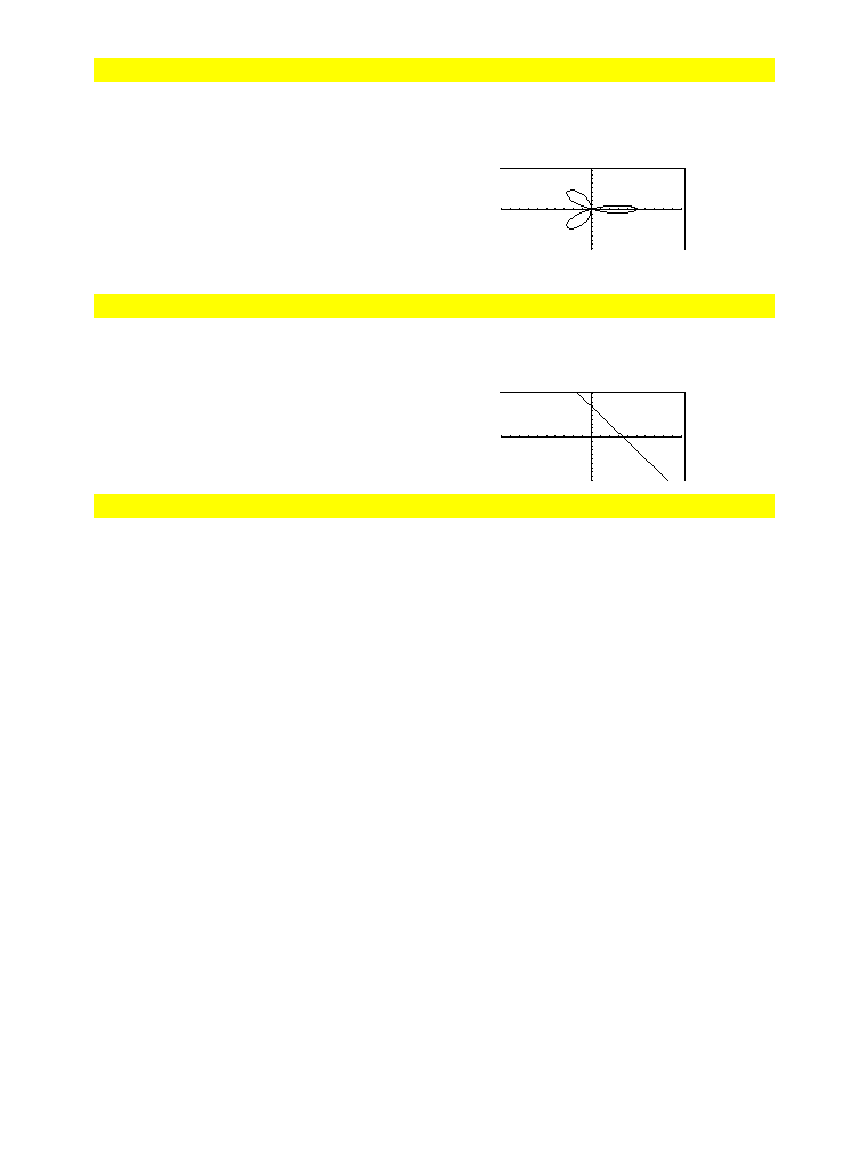
In function graphing mode and
ZoomStd
window:
DrawPol 5
ù
cos(3
ù
q
),0,3.5,.1
¸
DrawSlp
CATALOG
DrawSlp
x1
,
y1
,
slope
Displays the graph and draws a line using the
formula
y
ì
y1=slope
ø
(x
ì
x1)
.
Note: Regraphing erases all drawn items.
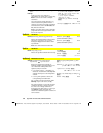
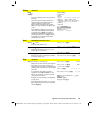
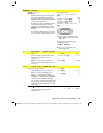
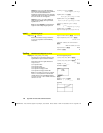
In function graphing mode and
ZoomStd
window:
DrawSlp 2,3,
ë
2
¸
DropDown
CATALOG
DropDown
titleString
, {
item1String
,
item2String
, ...},
varName
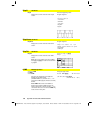
Displays a drop-down menu with the name
titleString
and containing the items
1:
item1String
,
2:
item2String
, and so forth.
DropDown
must be within a
Dialog...EndDlog
block.
If
varName
already exists and has a value
within the range of items, the referenced item
is displayed as the default selection.
Otherwise, the menu’s first item is the default
selection.
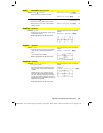
When you select an item from the menu, the
corresponding number of the item is stored
in the variable
varName
. (If necessary,
DropDown
creates
varName
.)
See
Dialog
program listing example.