


Chapter 11: Differential Equation Graphing 183
11DIFFEQ.DOC TI-89/TI-92 Plus: Differential Equation (English) Susan Gullord Revised: 02/23/01 11:04 AM Printed: 02/23/01 2:15 PM Page 183 of 26
When a slope or direction field is drawn, a picture of the field is
stored automatically to a system variable named
fldpic
. If you
perform an operation that regraphs the plotted equations but does
not affect the field, the
TI
-
89 / TI
-
92 Plus
reuses the picture in
fldpic
instead of having to redraw the field. This can speed up the
regraphing time significantly.
fldpic
is deleted automatically when you exit the differential equation
graphing mode or when you display a graph with
Fields = FLDOFF
.
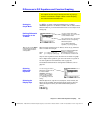
As in function graphing, you can explore a graph by using the
following tools. Any displayed coordinates are shown in rectangular
or polar form as set in the graph format.
Tool For Differential Equation Graphs:
Free-Moving
Cursor
Works just as it does for function graphs.
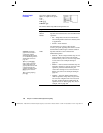
„
Zoom
Works just as it does for function graphs.
¦
Only
x
(
xmin
,
xmax
,
xscl
) and
y
(
ymin
,
ymax
,
yscl
)
Window variables are affected.
¦
The
t
Window variables (
t0
,
tmax
,
tstep
,
tplot
) are
not affected unless you select
6:ZoomStd
(which
sets all Window variables to their standard values).
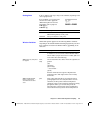
…
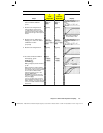
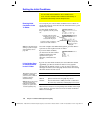
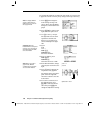
Trace
Lets you move the cursor along the curve one t
step
at
a time. To move approximately ten plotted points at a
time, press
2B
or
2A
.
If you enter initial conditions in the Y= Editor or let
the
ncurves
Window variable plot curves
automatically, you can trace the curves. If you use:
TI
-
89
:
2Š
TI
-
92 Plus:
Š
IC
from the Graph screen to select initial conditions
interactively, you cannot trace the curves.
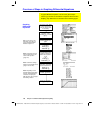
QuickCenter
applies to all directions. If you move the
cursor off the screen (top or bottom, left or right),
press
¸
to center the viewing window on the
cursor location. Use
C
or
D
to view results on all
plotted curves.
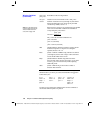
‡
Math
Only
1:Value
is available.
¦
With
TIME
axes, the
y(t)
solution value (represented
by
yc
) is displayed for a specified
t
value.
¦
With
CUSTOM
axes, the values that correspond to
x
and
y
depend on the axes you choose.
The fldpic System
Variable
Exploring a Graph
Tip: During a trace, you can
move the cursor to a
particular point by typing a
value for t and pressing
¸
.
Tip: You can use
QuickCenter at any time
during a trace, even if the
cursor is still on the screen.