


Chapter 10: 3D Graphing 167
10_3D.DOC TI-89/TI-92 Plus: 3D Graphing (English) Susan Gullord Revised: 02/23/01 11:00 AM Printed: 02/23/01 4:22 PM Page 167 of 22
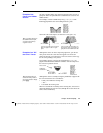
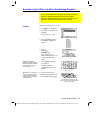
In 3D graphing mode, define an equation and graph it as you would
any 3D equation, with the following exception. Display the
GRAPH
FORMATS
dialog box by pressing ƒ
9
from the Y= Editor, Window
editor, or Graph screen. Then set:
Style = CONTOUR LEVELS
– or –
Style = WIRE AND CONTOUR
¦
For
CONTOUR LEVELS
, only the contours are shown.
− The viewing angle is set initially so that you are viewing the
contours by looking down the z axis. You can change the
viewing angle as necessary.
− The graph is shown in expanded view. To switch between
expanded and normal view, press
p
.
− The
Labels
format is set to
OFF
automatically.
¦ For
WIRE AND CONTOUR
, the contours are drawn on a wire
frame view. The viewing angle, view (expanded or normal), and
Labels
format retain their previous settings.
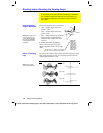
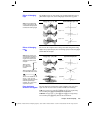
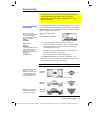
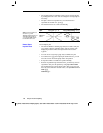
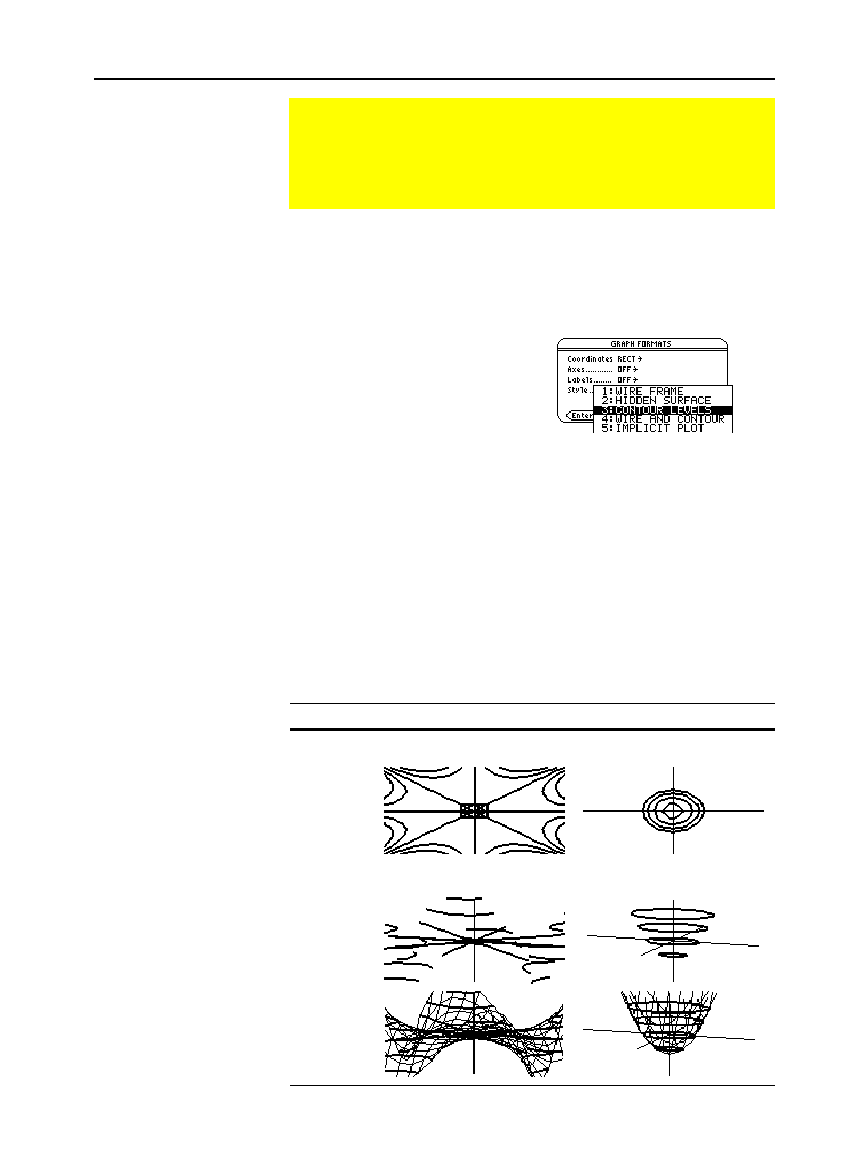
Style z1(x,y)=(xò yìyòx) / 390 z1(x,y)=xñ+.5yñì5
Looking down z axis
CONTOUR
LEVELS
Using eye
q
=20, eye
f
=70, eye
ψ
=0
CONTOUR
LEVELS
WIRE AND
CONTOUR
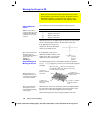
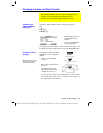
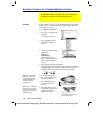
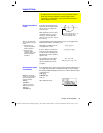
Contour Plots
In a contour plot, a line is drawn to connect adjacent points on
the 3D graph that have the same z value. This section
discusses the CONTOUR LEVELS and WIRE AND CONTOUR
graph format styles.
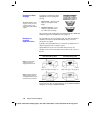
Selecting the Graph
Format Style
Tip:
From the Graph
screen, you can switch from
one graph format style to
the next (skipping
IMPLICIT
PLOT
) by pressing:
TI
-
89
:
Í
TI
-
92 Plus
:
F
Note:
Pressing:
TI
-
89
:
Í
TI
-
92 Plus
:
F
to select
CONTOUR LEVELS
does not affect the viewing
angle, view, or
Labels
format as it does if you use:
TI
-
89
:
¥Í
TI
-
92 Plus
:
¥
F
Note:
These examples use
the same
x
,
y
, and
z
Window variable values as
a
ZoomStd viewing cube. If
y
ou use ZoomStd, press
Z
to look down the z axis.
Note:
Do not confuse the
contours with the grid lines.
The contours are darker.