260 Chapter 16: Statistics and Data Plots
16STATS.DOC TI-89/TI-92 Plus: Statistics and Data Plots (English) Susan Gullord Revised: 02/23/01 1:12 PM Printed: 02/23/01 2:17 PM Page 260 of 22
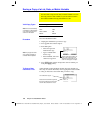
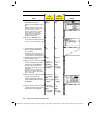
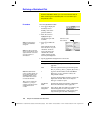
Item Description
Freq
Type the column number that contains a
“weight” value for each data point. If you do
not enter a column number, all data points are
assumed to have the same weight (
1
).
Category
Type the column number that contains a
category value for each data point.
Include
Categories
If you specify a
Category
column, you can use
this item to limit the calculation to specified
category values. For example, if you specify
{
1,4
}, the calculation uses only data points with
a category value of
1
or
4
.
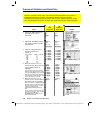
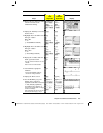
3. Press
¸
(after typing in an input box, press
¸
twice).
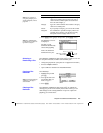
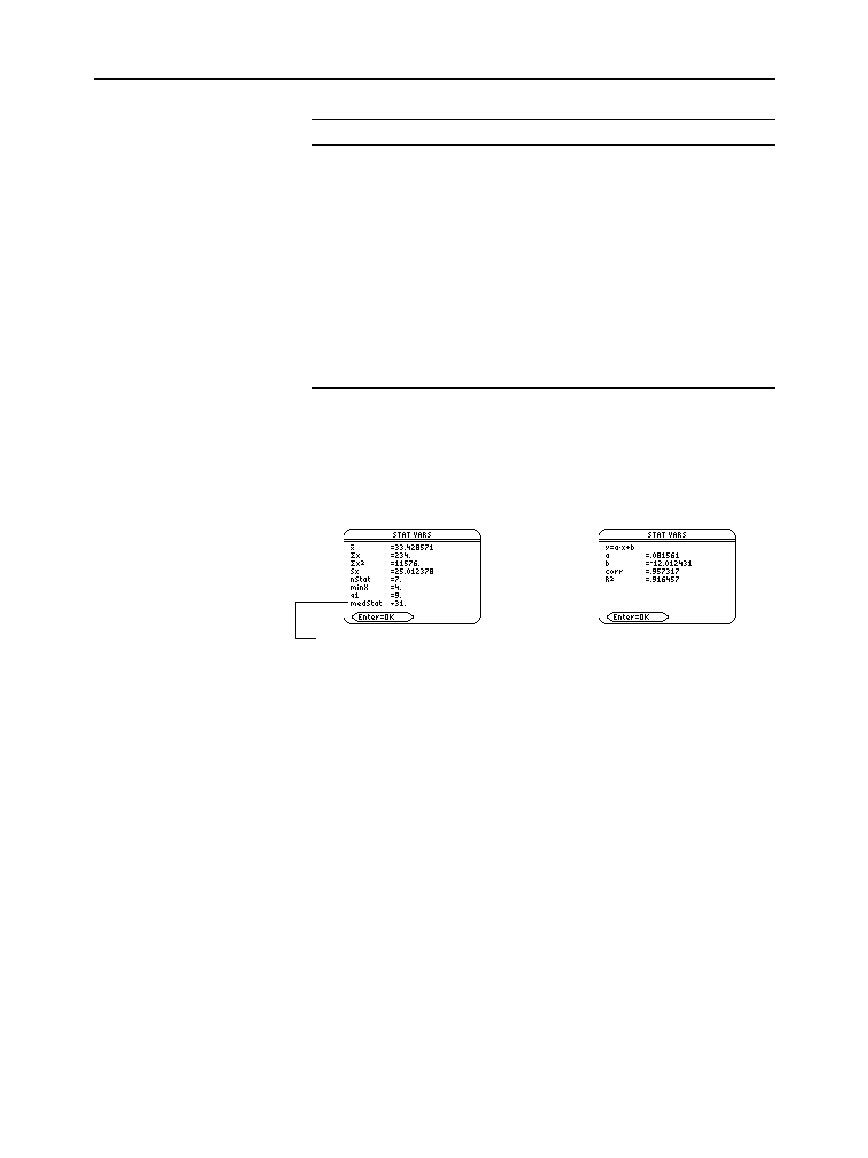
The results are displayed on the
STAT VARS
screen. The format
depends on the
Calculation Type
. For example:
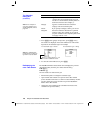
For Calculation Type = OneVar For Calculation Type = LinReg
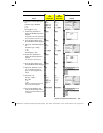
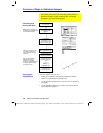
4. To close the
STAT VARS
screen, press
¸
.
The Data/Matrix Editor’s
Stat
toolbar menu redisplays the previous
calculation results (until they are cleared from memory).
TI
-
89
:
2‰
TI
-
92 Plus:
‰
Previous results are cleared when you:
¦
Edit the data points or change the
Calculation Type
.
¦ Open another data variable or reopen the same data variable
(if the calculation referred to a column in a data variable). Results
are also cleared if you leave and then reopen the Data/Matrix
Editor with a data variable.
¦ Change the current folder (if the calculation referred to a list
variable in the previous folder).
The Calculate
Dialog Box
(Continued)
Note: For an example of
using Freq, Category, and
Include Categories, refer to
page 270.
Note: Any undefined data
points (shown as
undef
) are
ignored in a stat calculation.
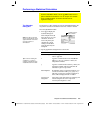
Redisplaying the
STAT VARS
Screen
When
6
is shown instead of =, you
can scroll for additional results.


