140 Chapter 9: Sequence Graphing
09SEQUEN.DOC TI-89/TI-92 Plus: Sequence Graphing (English) Susan Gullord Revised: 02/23/01 10:59 AM Printed: 02/23/01 2:14 PM Page 140 of 14
Steps
³
TI-89
Keystrokes
›
TI-92 Plus
Keystrokes Display
1. Display the
MODE
dialog box.
For
Graph
mode, select
SEQUENCE
.
3
B
4
¸
3
B
4
¸
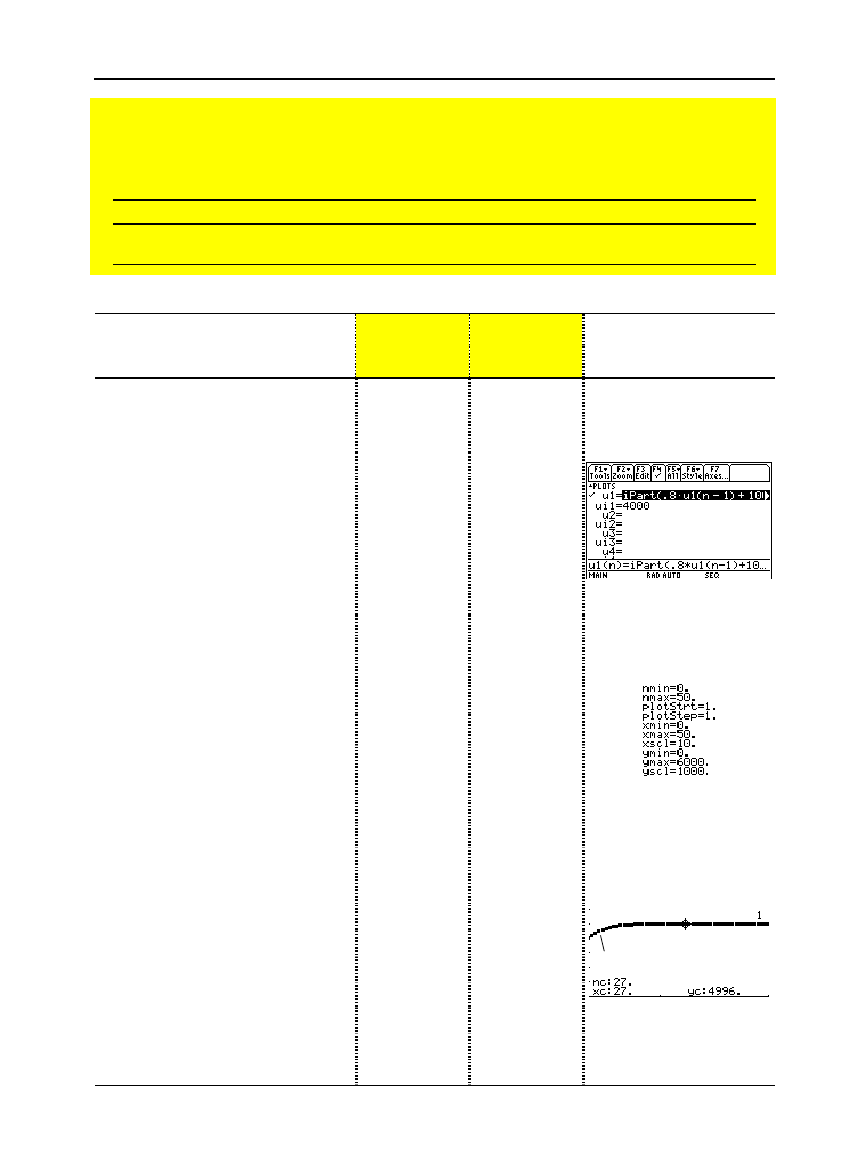
2. Display and clear the Y= Editor.
Then define the sequence as
u1(n) = iPart(.8
ù
u1(n
ì
1)+1000)
.
Use
iPart
to take the integer part of
the result. No fractional trees are
harvested.
To access
iPart(
, you can use
2I
, simply type it, or
select it
from the CATALOG
.
¥#
ƒ
8
¸
¸
2I
14
.8
j
U1
c
j
N
|
1
d«
1000
d¸
¥#
ƒ
8
¸
¸
2I
14
.8U1
c
N
|
1
d«
1000
d¸
3. Define
ui1
as the initial value
that will be used as the first
term.
¸
4000
¸
¸
4000
¸
4. Display the Window Editor. Set
the
n
and
plot
Window variables.
nmin=0 and nmax=50 evaluate the
size of the forest over 50 years.
¥$
0
D
50
D
1
D
1
D
¥$
0
D
50
D
1
D
1
D
5. Set the
x
and
y
Window variables
to appropriate values for this
example.
0
D
50
D
10
D
0
D
6000
D
1000
0
D
50
D
10
D
0
D
6000
D
1000
6. Display the Graph screen.
¥%
¥%
7. Select
Trace
. Move the cursor to
trace year by year. How many
years (
nc
) does it take the
number of trees (
yc
) to stabilize?
Trace begins at nc=0.
nc is the number of years.
xc = nc since n is plotted on the x
axis.
yc = u1(n), the number of trees at
year n.
…
B
and
A
as necessary
…
B
and
A
as necessary
Preview of Sequence Graphing
A small forest contains 4000 trees. Each year, 20% of the trees will be harvested (with 80%
remaining) and 1000 new trees will be planted. Using a sequence, calculate the number of
trees in the forest at the end of each year. Does it stabilize at a certain number?
Initially After 1 Year After 2 Years After 3 Years . . .
4000 .8 x 4000
+ 1000
.8 x (.8 x 4000 + 1000)
+ 1000
.8 x (.8 x (.8 x 4000 + 1000) + 1000)
+ 1000
. . .
By default, sequences use
the Square display style.


