


210 Chapter 12: Additional Graphing Topics
12ADDLGR.DOC TI-89/TI-92 Plus: Additional Graphing Tools (English) Susan Gullord Revised: 02/23/01 1:03 PM Printed: 02/23/01 2:15 PM Page 210 of 20
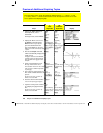
Both Graph 1 and Graph 2 have independent:
¦
Graph
modes (
FUNCTION
,
POLAR
, etc.). Other modes such as
Angle
,
Display Digits
, etc., are shared and affect both graphs.
¦ Window Editor variables.
¦ Table setup parameters and Table screens.
¦ Graph formats such as
Coordinates
,
Axes
, etc.
¦
Graph screens.
¦ Y= Editors. However, both graphs share common function and
stat plot definitions.
Independent graph-related applications (Y= Editor, Graph screen,
etc.) can be displayed on both sides of the screen at the same time.
Non-graph-related applications (Home screen, Data/Matrix Editor,
etc.) are shared and can be displayed on only one side at a time.
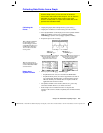
Even in two-graph mode, there is actually only one Y= Editor, which
maintains a single function list for each
Graph
mode setting.
However, if both sides use the same graphing mode, each side can
select different functions from that single list.
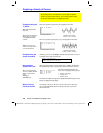
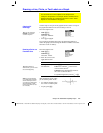
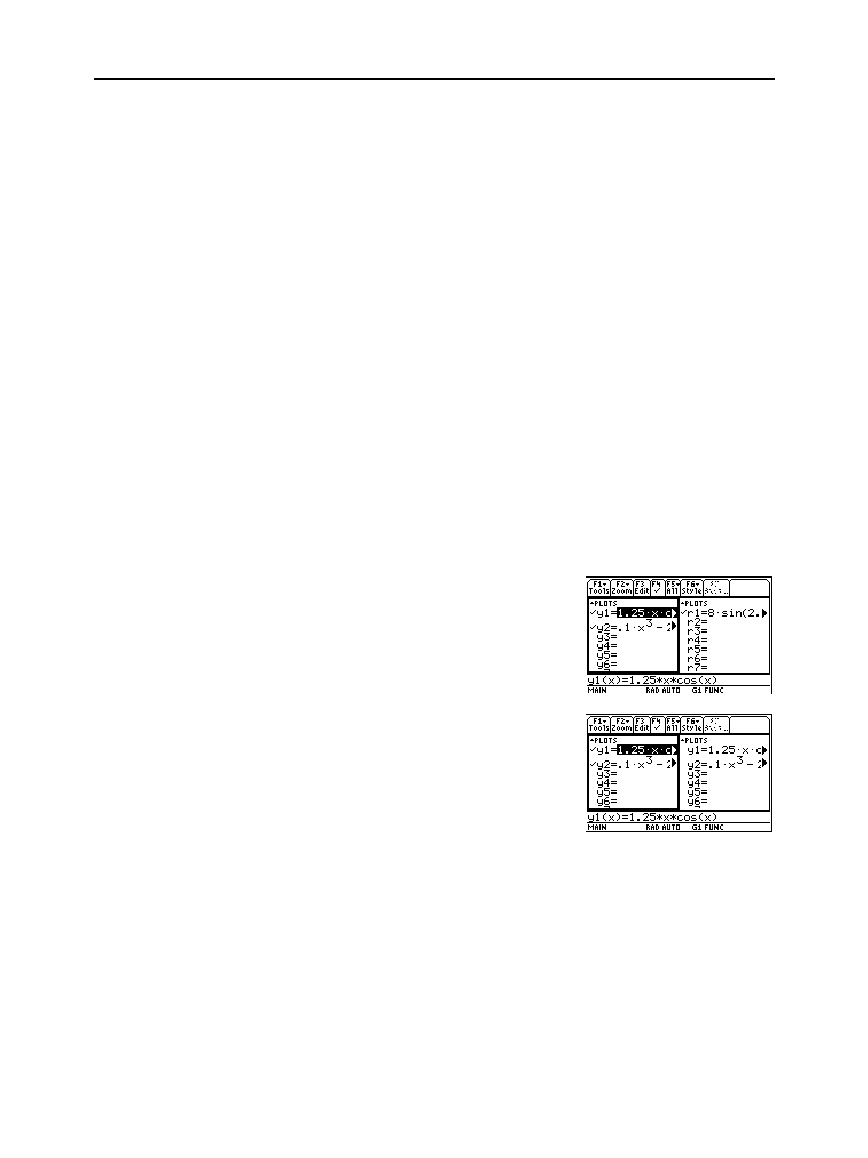
¦ When both sides use
different graphing modes,
each side shows a
different function list.
¦ When both sides use
the same graphing mode,
each side shows the
same function list.
− You can use
†
to
select different
functions and stat
plots (indicated by
Ÿ
)
for each side.
− If you set a display
style for a function,
that style is used by
both sides.
(
TI
-
89
:
2
ˆ
TI
-
92 Plus:
ˆ)
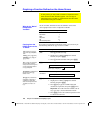
Independent Graph-
Related Features
Note: The Y= Editor is
completely independent
only when the two sides use
different graphing modes
(as described below).
The Y= Editor in
Two-Graph Mode
Note: If you make a change
on the active Y= Editor
(redefine a function, change
a style, etc.), that change is
not reflected on the inactive
side until you switch to it.
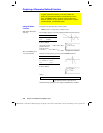
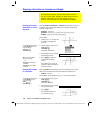
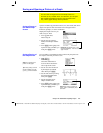
Suppose Graph 1 and Graph 2 are
set for function graphing. Although
both sides show the same function
list, you can select (
Ÿ
) different
functions for graphing.