


194 Chapter 11: Differential Equation Graphing
11DIFFEQ.DOC TI-89/TI-92 Plus: Differential Equation (English) Susan Gullord Revised: 02/23/01 11:04 AM Printed: 02/23/01 2:15 PM Page 194 of 26
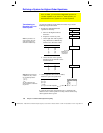
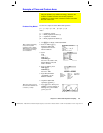
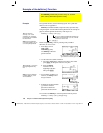
9. Return to the Home screen,
and use
BldData
to create a
data variable containing the
Euler
graphing points.
BldData eulerlog
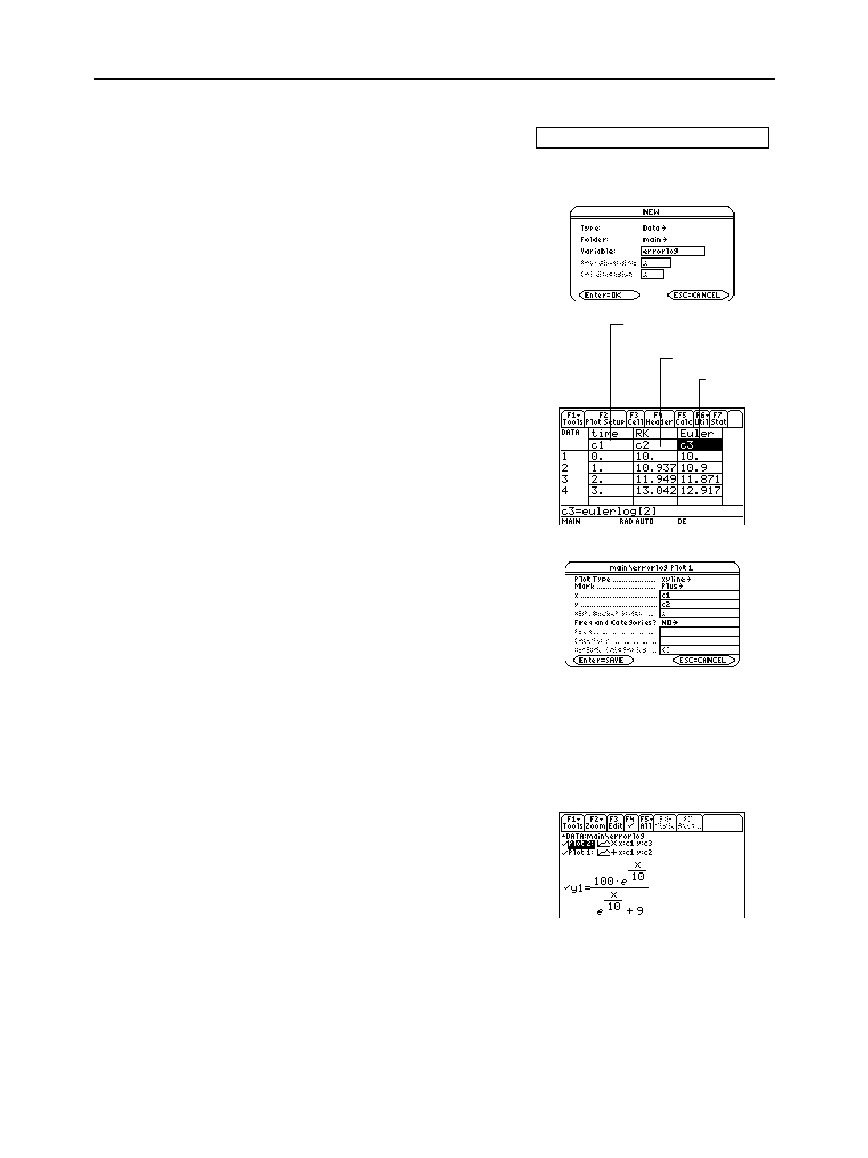
10. Use the Data/Matrix Editor
(
O
6 3
) to create a new
data variable named
errorlog
.
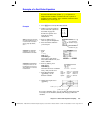
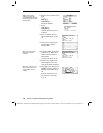
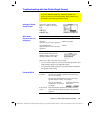
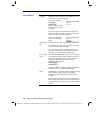
11. In this new data variable,
define the
c1
,
c2
, and
c3
column headers to refer to
data in
rklog
and
eulerlog
.
Also, enter column titles as
shown.
To define a column header,
move the cursor to that
column, press
†
, type the
reference expression (such
as
rklog[1]
for
c1
), and press
¸
.
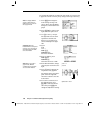
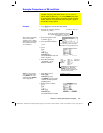
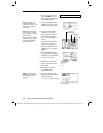
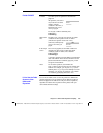
12. In the Data/Matrix Editor,
press
„
. Then press
ƒ
and
define Plot 1 for the RK data,
as shown to the right.
13. Define Plot 2 for the Euler
data. Use the values shown
to the right.
Plot Type=xyline
Mark=Cross
x=c1
y=c3
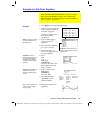
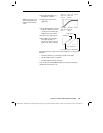
14. Return to the Y= Editor,
press
3
, and set
Graph = FUNCTION
.
15. The exact solution to the
differential equation is given
below. Enter it as
y1
.
y1 = (100
ù
e
^(x/10))/(
e
^(x/10)+9)
Note:
errorlog
lets you
combine the data in
rklog
and
eulerlog
so that you can
view the two sets of data
side by side.
Note:
rklog[1]
and
rklog[2]
refer to column 1 and 2 in
rklog
, respectively. Likewise
with
eulerlog[2]
.
Tip: Scroll through the data
variable to see how the RK
and Euler values differ for
the same time value.
Note: To see how to use
deSolve()
to find this exact,
general solution, refer to
page 196.
c3=
eulerlog[2]
c2=rklog[2]
c1=rklog[1] or
c1=eulerlog[1]
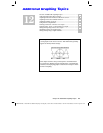
You can use
C
to scroll up to see
Plot 1 and Plot 2.