


Chapter 6: Basic Function Graphing 115
06BASFUN.DOC TI-89/TI-92 Plus: Basic Function Graphing (English) Susan Gullord Revised: 02/23/01 4:09 PM Printed: 02/23/01 4:18 PM Page 115 of 22
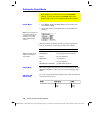
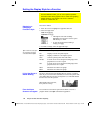
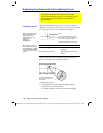
Press
¥%
or
O
4
. The
TI
-
89 / TI
-
92 Plus
automatically graphs
the selected functions.
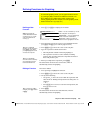
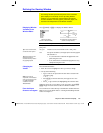
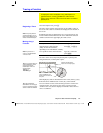
While graphing is in progress:
¦
To pause graphing temporarily, press
¸
. (The
PAUSE
indicator replaces
BUSY
.) To resume, press
¸
again.
¦
To cancel graphing, press
´
. To start graphing again from the
beginning, press
†
(
ReGraph
).
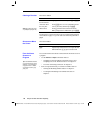
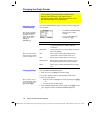
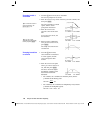
Depending on various settings, a function may be graphed such that
it is too small, too large, or offset too far to one side of the screen. To
correct this:
¦
Redefine the viewing window with different boundaries
(page 113).
¦
Use a
Zoom
operation (page 119).
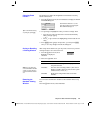
When you display the Graph screen, the
Smart Graph
feature displays
the previous window contents immediately, provided nothing has
changed that requires regraphing.
Smart Graph
updates the window and regraphs only if you have:
¦
Changed a mode setting that affects graphing, a function’s
graphing attribute, a Window variable, or a graph format.
¦
Selected or deselected a function or stat plot. (If you only select a
new function,
Smart Graph
adds that function to the Graph screen.)
¦
Changed the definition of a selected function or the value of a
variable in a selected function.
¦
Cleared a drawn object (Chapter 12).
¦
Changed a stat plot definition (Chapter 16).
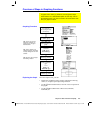
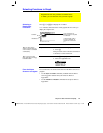
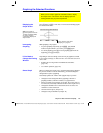
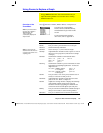
Graphing the Selected Functions
When you are ready to graph the selected functions, display
the Graph screen. This screen uses the display style and
viewing window that you previously defined.
Displaying the
Graph Screen
Note: If you select an
„
Zoom operation from the
Y= Editor or Window Editor,
the
TI
-
89 / TI
-
92 Plus
automatically displays the
Graph screen.
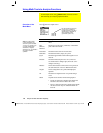
Interrupting
Graphing
If You Need to
Change the Viewing
Window
Smart Graph
BUSY
indicator shows while
graphing is in progress.