


268 Chapter 16: Statistics and Data Plots
16STATS.DOC TI-89/TI-92 Plus: Statistics and Data Plots (English) Susan Gullord Revised: 02/23/01 1:12 PM Printed: 02/23/01 2:17 PM Page 268 of 22
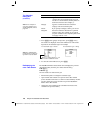
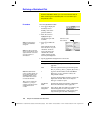
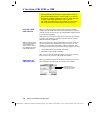
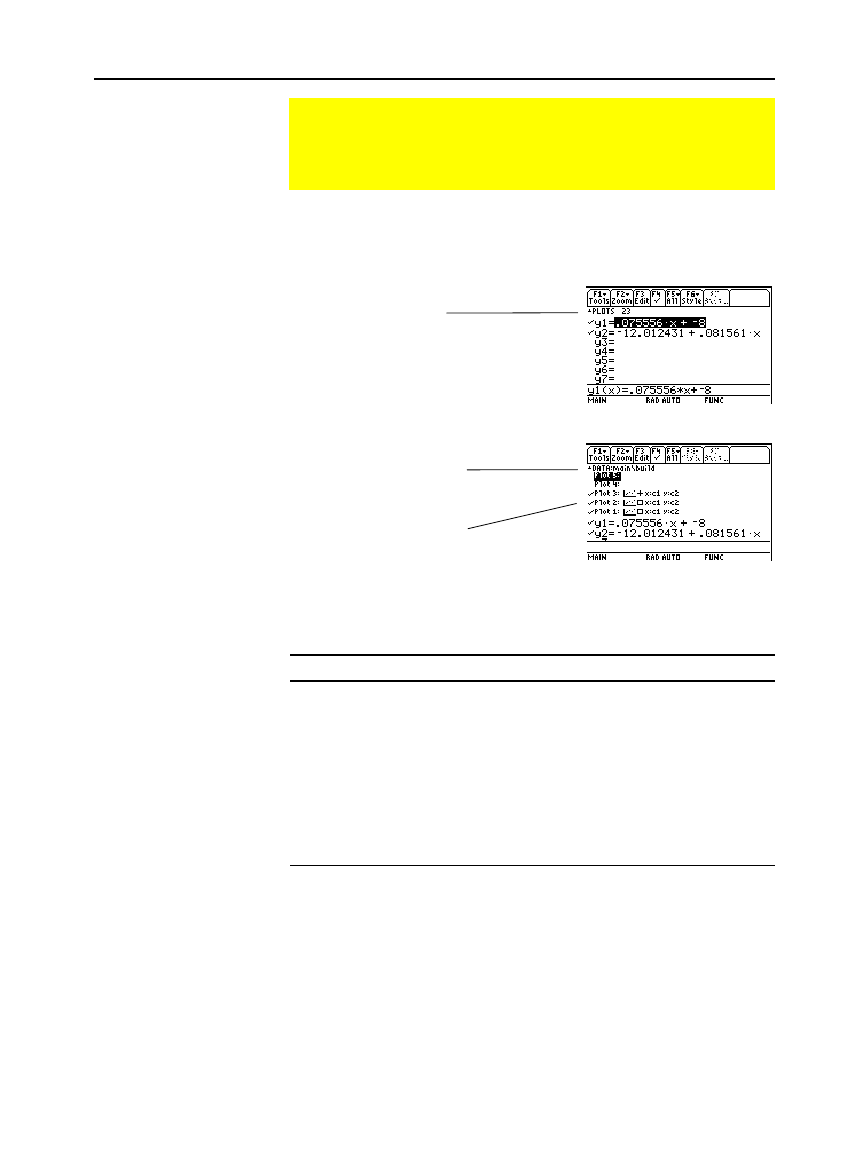
Press
¥#
to display the Y= Editor. Initially, the nine stat plots are
located “off the top” of the screen, above the
y(x)
functions.
However, the
PLOTS
indicator provides some information.
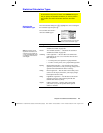
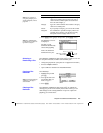
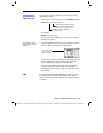
To see the list of stat plots, use
C
to scroll above the
y(x)
functions.
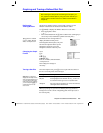
From the Y= Editor, you can perform most of the same operations on
a stat plot as you can on any other
y(x)
function.
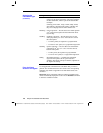
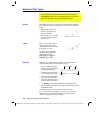
To: Do this:
Edit a plot
definition
Highlight the plot and press
…
. You will see the
same definition screen that is displayed in the
Data/Matrix Editor.
Select or deselect
a plot
Highlight the plot and press
†
.
Turn all plots
and/or functions
off
Press
‡
and select the applicable item. You
can also use this menu to turn all functions on.
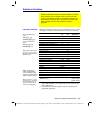
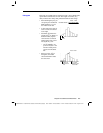
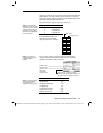
As necessary, you can select and graph stat plots and
y(x)
functions
at the same time. The preview example at the beginning of this
chapter graphs data points and their regression equations.
Using the Y= Editor with Stat Plots
The previous sections described how to define and select stat
plots from the Data/Matrix Editor. You can also define and
select stat plots from the Y= Editor.
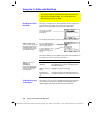
Showing the List of
Stat Plots
Note: Plots defined with
column numbers always us
e
the last data variable in the
Data/Matrix Editor, even if
that variable was not used
to create the definition.
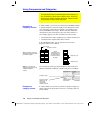
Note: You can not use
TI
-
89:
2ˆ
TI
-
92 Plus:
ˆ
to set a plot’s display style.
However, the plot definition
lets you select the mark
used for the plot.
To Graph Plots and
Y= Functions
For example, PLOTS 23
means that Plots 2 & 3
are selected.
If a Plot is defined, it shows
the same shorthand
notation as the Plot Setup
screen.
If a Plot is highlighted, this
shows the data variable that
will be used for the plots.