


154 Chapter 10: 3D Graphing
10_3D.DOC TI-89/TI-92 Plus: 3D Graphing (English) Susan Gullord Revised: 02/23/01 11:00 AM Printed: 02/23/01 4:22 PM Page 154 of 2210_3D.DOC TI-89/TI-92 Plus: 3D Graphing (English) Susan Gullord Revised: 02/23/01 11:00 AM Printed: 02/23/01 4:22 PM Page 154 of 22
Steps
³
TI
-
89
Keystrokes
›
TI
-
92 Plus
Keystrokes Display
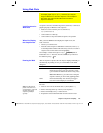
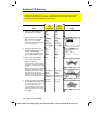
1. Display the
MODE
dialog box.
For
Graph
mode, select
3D
.
3
B
5
¸
3
B
5
¸
2. Display and clear the Y= Editor.
Then define the 3D equation
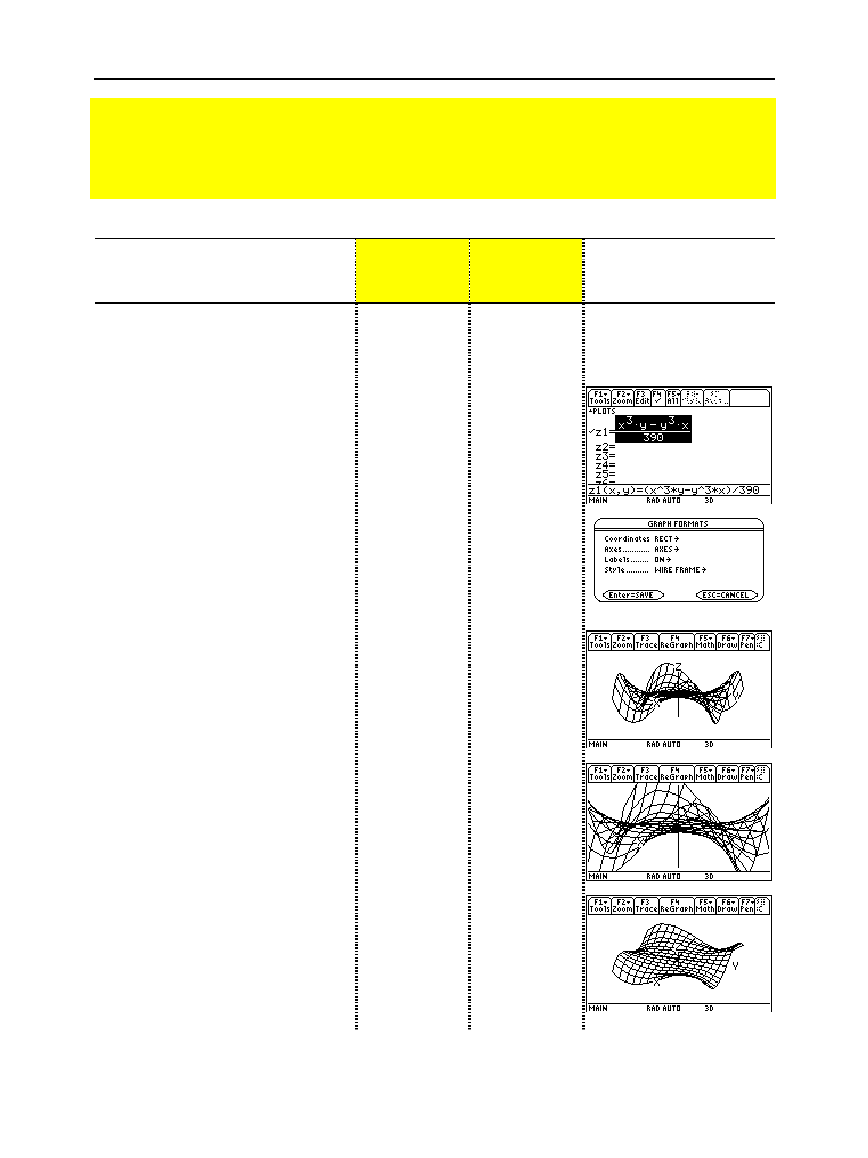
z1(x,y) = (x
ò
y
ì
y
ò
x) / 390
.
Notice that implied multiplication is
used in the keystrokes.
¥#
ƒ
8
¸
¸
c
X
Z
3Y
|
Y
Z
3X
d
e
390
¸
¥#
ƒ
8
¸
¸
c
X
Z
3Y
|
Y
Z
3X
d
e
390
¸
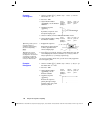
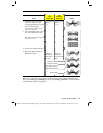
3. Change the graph format to
display and label the axes. Also
set
Style = WIRE FRAME
.
You can animate any graph format
style, but
WIRE FRAME
is fastest.
¥Í
DB
2
DB
2
DB
1
¸
¥
F
DB
2
DB
2
DB
1
¸
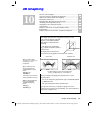
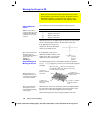
4. Select the
ZoomStd
viewing
cube, which automatically
graphs the equation.
As the equation is evaluated (before it
is graphed), “evaluation percentages”
are shown in the upper-left part of the
screen.
„
6
„
6
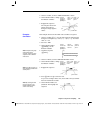
Note:
If you have already used 3D
graphing, the graph may be shown in
expanded view. When you animate
the graph, the screen returns to
normal view automatically. (Except for
animation, you can do the same
things in normal and expanded view.)
p
(press
p
to
switch
between
expanded and
normal view)
p
(press
p
to
switch
between
expanded and
normal view)
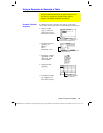
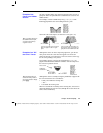
5. Animate the graph by decreasing
the
eye
f
Window variable value.
D
or
C
may affect
eye
q
and
eye
ψ
, but
to a lesser extent than
eye
f
.
To animate the graph continuously,
press and hold the cursor for about 1
second and then release it. To stop,
press
¸
.
DDDD
DDDD
DDDD
DDDD
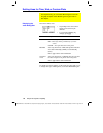
Preview of 3D Graphing
Graph the 3D equation z(x,y) = (x
ò
y
ì
y
ò
x) / 390. Animate the graph by using the cursor
to interactively change the eye Window variable values that control your viewing angle.
Then view the graph in different graph format styles.