


Chapter 8: Polar Graphing 137
08POLAR.DOC TI-89/TI-92 Plus: Polar Graphing (English) Susan Gullord Revised: 02/23/01 10:57 AM Printed: 02/23/01 2:14 PM Page 137 of 6
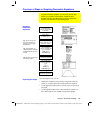
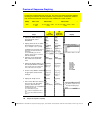
The Window Editor maintains an independent set of Window
variables for each
Graph
mode setting (just as the Y= Editor
maintains independent function lists). Polar graphs use the following
Window variables.
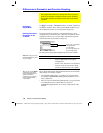
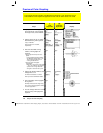
Variable Description
q
min,
q
max
Smallest and largest
q
values to evaluate.
q
step
Increment for the
q
value. Polar equations are
evaluated at:
r(
q
min)
r(
q
min+
q
step)
r(
q
min+2(
q
step))
... not to exceed ...
r(
q
max)
xmin
,
xmax
,
ymin
,
ymax
Boundaries of the viewing window.
xscl
,
yscl
Distance between tick marks on the x and y axes.
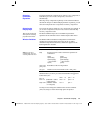
Standard values (set when you select
6:ZoomStd
from the
„
Zoom
toolbar menu) are:
q
min = 0.
xmin =
ë
10. ymin =
ë
10.
q
max = 2
p
(6.2831853... radians
or 360 degrees)
xmax = 10. ymax = 10.
q
step =
p
/24 (.1308996... radians
or 7.5 degrees)
xscl = 1. yscl = 1.
You may need to change the standard values for the
q
variables
(
q
min
,
q
max
,
q
step
) to ensure that enough points are plotted.
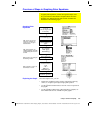
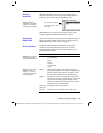
To display coordinates as
r
and
q
values, use:
ƒ
9
—
or
—
TI
-
89
:
¥Í
TI
-
92 Plus
:
¥
F
to set
Coordinates = POLAR
. If
Coordinates = RECT
, the polar
equations will be graphed properly, but coordinates will be displayed
as
x
and
y
.
When you trace a polar equation, the
q
coordinate is shown even if
Coordinates = RECT
.
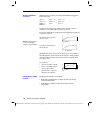
Window Variables
Note: You can use a
negative
q
step. If so,
q
min
must be greater than
q
max.
Setting the Graph
Format