


262 Chapter 16: Statistics and Data Plots
16STATS.DOC TI-89/TI-92 Plus: Statistics and Data Plots (English) Susan Gullord Revised: 02/23/01 1:12 PM Printed: 02/23/01 2:17 PM Page 262 of 22
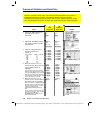
Calc Type Description
MedMed
Median-Median — Fits the data to the model
y=ax+b
(where
a
is the slope, and
b
is the y-intercept) using the
median-median line, which is part of the resistant line
technique.
Summary points
medx1
,
medy1
,
medx2
,
medy2
,
medx3
,
and
medy3
are calculated and stored to variables, but
they are not displayed on the
STAT VARS
screen.
PowerReg
Power regression — Fits the data to the model equation
y=ax
b
using a least-squares fit and transformed values
ln(x)
and
ln(y)
.
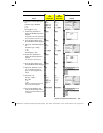
QuadReg
Quadratic regression — Fits the data to the second-
order polynomial
y=ax
ñ
+bx+c
. You must have at least
three data points.
¦ For three points, the equation is a polynomial fit.
¦
For four or more points, it is a polynomial regression.
QuartReg
Quartic regression — Fits the data to the fourth-order
polynomial
y=ax
4
+bx
ò
+cx
ñ
+ dx+e
. You must have at
least five data points.
¦ For five points, the equation is a polynomial fit.
¦ For six or more points, it is a polynomial regression.
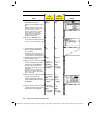
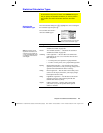
SinReg
Sinusoidal regression — Calculates the sinusoidal
regression and updates all the system statistics
variables. The output is always in radians, regardless of
the angle mode setting.
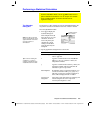
Use the applicable command for the calculation that you want to
perform. The commands have the same name as the corresponding
Calculation Type
. Refer to Appendix A for information about each
command.
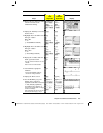
Important:
These commands perform a statistical calculation but
do not automatically display the results. Use the
ShowStat
command
to show the calculation results.
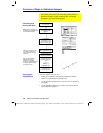
Selecting the
Calculation Type
(Continued)
From the Home
Screen or a Program