


Chapter 11: Differential Equation Graphing 195
11DIFFEQ.DOC TI-89/TI-92 Plus: Differential Equation (English) Susan Gullord Revised: 02/23/01 11:04 AM Printed: 02/23/01 2:15 PM Page 195 of 26
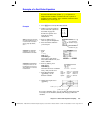
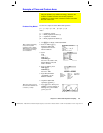
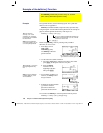
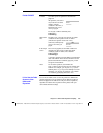
16. In the Window Editor, set
the Window variables.
xmin=ë 10. ymin=ë 10. xres=2.
xmax=100. ymax=120.
xscl=10. yscl=10.
17. Display the Graph screen
(
¥%
).
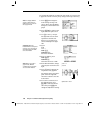
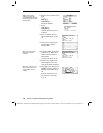
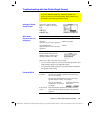
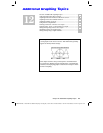
18. In the Window Editor, set the
Window variables to zoom in
so that you can examine the
differences in more detail.
xmin=39.7 ymin=85.5 xres=2.
xmax=40.3 ymax=86.
xscl=.1 yscl=.1
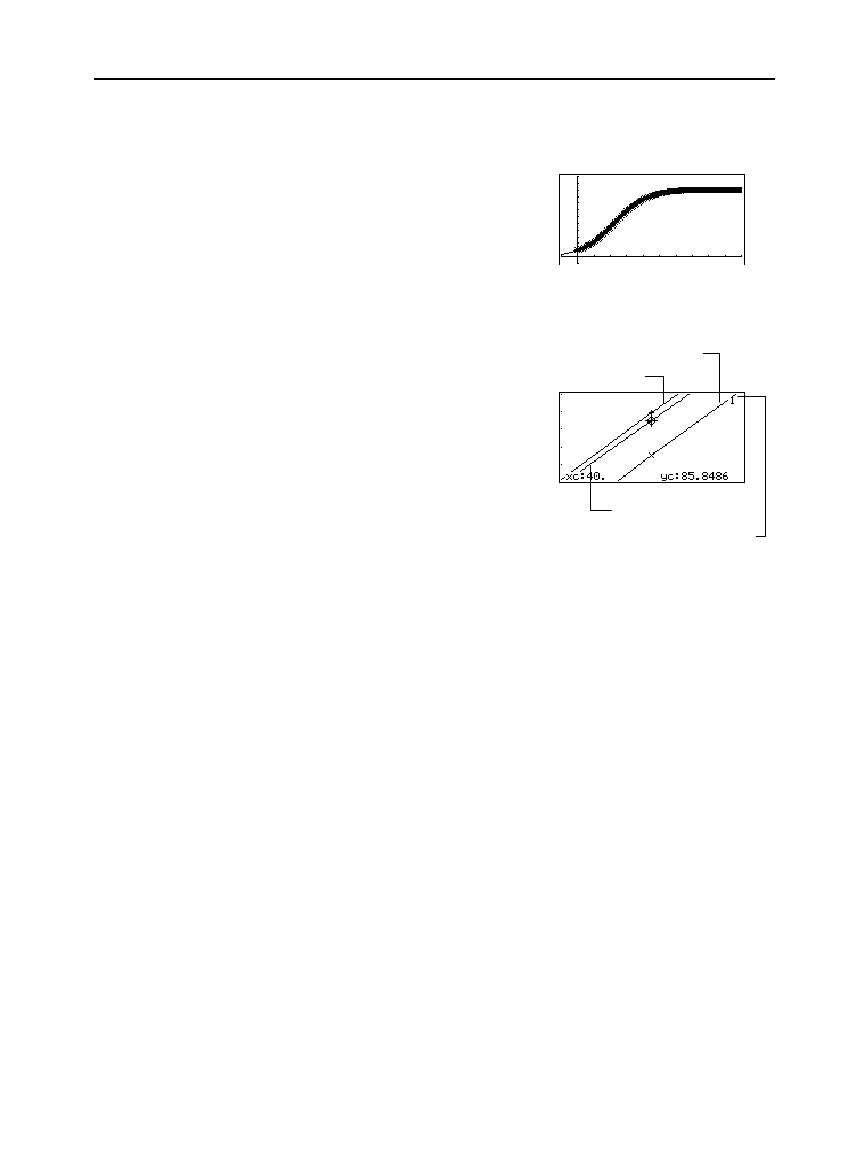
19. Return to the Graph screen.
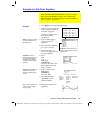
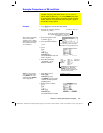
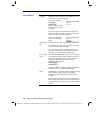
20. Press
…
to trace, and then
press
C
or
D
until
y1
is
selected. (
1
shows in upper
right corner.) Then enter 40.
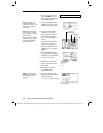
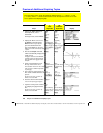
By moving the trace cursor to trace each solution to
xc = 40
, you can
find that:
¦ The exact solution (
y1
) is 85.8486, rounded to six digits.
¦
The
RK
solution (
Plot 1
) is 85.8952.
¦ The
Euler
solution (
Plot 2
) is 85.6527.
You can also use the Data/Matrix Editor to open the
errorlog
data
variable and scroll to
time = 40
.
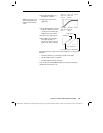
Note: The fuzzy line on the
graph indicates differences
between the RK and Euler
values.
y1 is selected when 1 shows here.
Euler (Plot 2)
RK (Plot 1)
Exact solution (y1)