116 Chapter 6: Basic Function Graphing
06BASFUN.DOC TI-89/TI-92 Plus: Basic Function Graphing (English) Susan Gullord Revised: 02/23/01 4:09 PM Printed: 02/23/01 4:18 PM Page 116 of 22
When you first display the Graph screen, no cursor is visible. To
display the cursor, press a cursor pad arrow. The cursor moves from
the center of the screen, and its coordinates are displayed.
To move the free-moving cursor: Press:
To an adjoining pixel A cursor pad arrow for any
direction.
In increments of 10 pixels
2
and then a cursor pad
arrow.
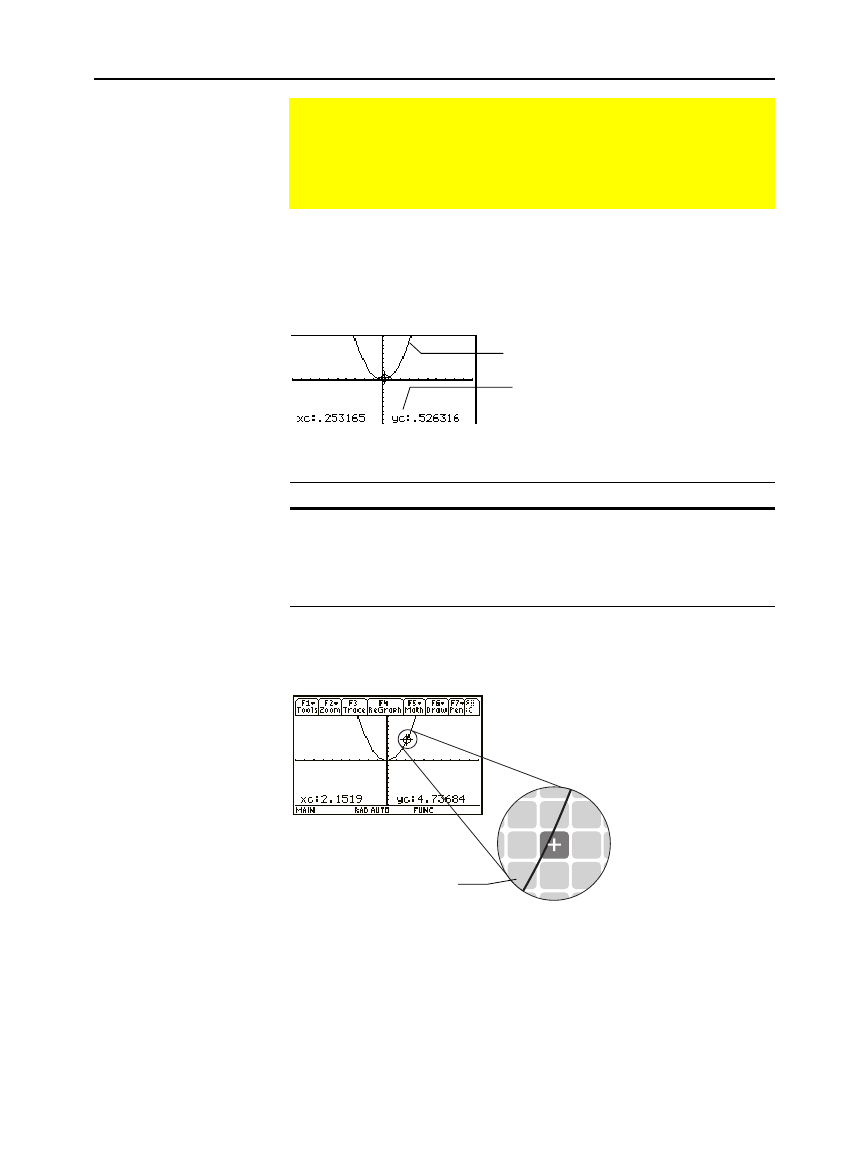
When you move the cursor to a pixel that appears to be “on” the
function, it may be near the function but not on it.
To increase the accuracy:
¦
Use the
Trace
tool described on the next page to display
coordinates that are on the function.
¦ Use a
Zoom
operation to zoom in on a portion of the graph.
Displaying Coordinates with the Free-Moving Cursor
To display the coordinates of any location on the Graph
screen, use the free-moving cursor. You can move the cursor
to any pixel on the screen; the cursor is not confined to a
graphed function.
Free-Moving Cursor
Tip: If your screen does not
show coordinates, set the
graph format so that
Coordinates =
RECT
or
POLAR
. Press:
TI
.
89:
¥
Í
TI
.
92 Plus:
¥
F
Tip: To hide the cursor and
its coordinates temporarily,
press
M
,
N
,
or
¸
.
The next time you move the
cursor, it moves from its last
position.
Cursor coordinates are for
the center of the pixel, not
the function.
The “c” indicates these are cursor
coordinates. The values are stored in
the xc and yc system variables.
Rectangular coordinates use xc and
yc. Polar coordinates use rc and
q
c.
y1(x)=x
ñ


