


202 Chapter 12: Additional Graphing Topics
12ADDLGR.DOC TI-89/TI-92 Plus: Additional Graphing Tools (English) Susan Gullord Revised: 02/23/01 1:03 PM Printed: 02/23/01 2:15 PM Page 202 of 20
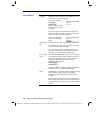
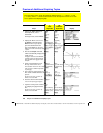
Steps
³
TI-89
Keystrokes
›
TI-92 Plus
Keystrokes Display
1. Display the
MODE
dialog box.
For
Graph
mode, select
FUNCTION
.
For
Angle
mode, select
RADIAN
.
3
B
1
DDD
B
1
¸
3
B
1
DDD
B
1
¸
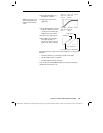
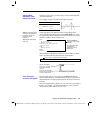
2. Display the Home screen. Use
the
Graph
command and the
when
function to specify the
piecewise defined function.
† 2
selects
Graph
from the
Other
toolbar menu and automatically adds
a space.
"
†
2
2™
WHEN
jc
X
2Â
0
b·
X
b
5
p2X
X
dd
¥"
†
2
WHEN
c
X
2Â
0
b·
X
b
5
pX
X
dd
Graph when(x<0,
ë
x,5
ù
cos(x))
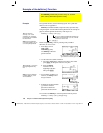
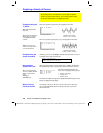
3. Execute the
Graph
command,
which automatically displays the
Graph screen.
The graph uses the current Window
variables, which are assumed to be
their standard values
(
„
6)
for this
example.
¸
¸
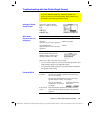
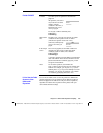
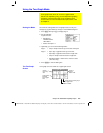
4. Draw a horizontal line across
the top of the cosine curve.
The calculator remains in “line” mode
until you select a different operation
or press
N
.
2‰
5
C
(until the line
is positioned)
¸
‰
5
C
(until the line
is positioned)
¸
5. Save a picture of the graph. Use
PIC1
as the variable name for the
picture.
Be sure to set Type = Picture. By
default, it is set to GDB.
ƒ
2
B
2
DD
PIC
j
1
¸¸
ƒ
2
B
2
DD
PIC 1
¸¸
6. Clear the drawn horizontal line.
You can also press
†
to regraph.
2ˆ
1
ˆ
1
7. Open the saved picture variable
to redisplay the graph with the
line.
Be sure to set Type = Picture. By
default, it is set to GDB.
ƒ
1
B
2
(if not already
shown, also set
Variable = pic1
)
¸
ƒ
1
B
2
(if not already
shown, also set
Variable = pic1
)
¸
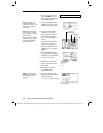
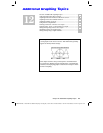
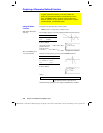
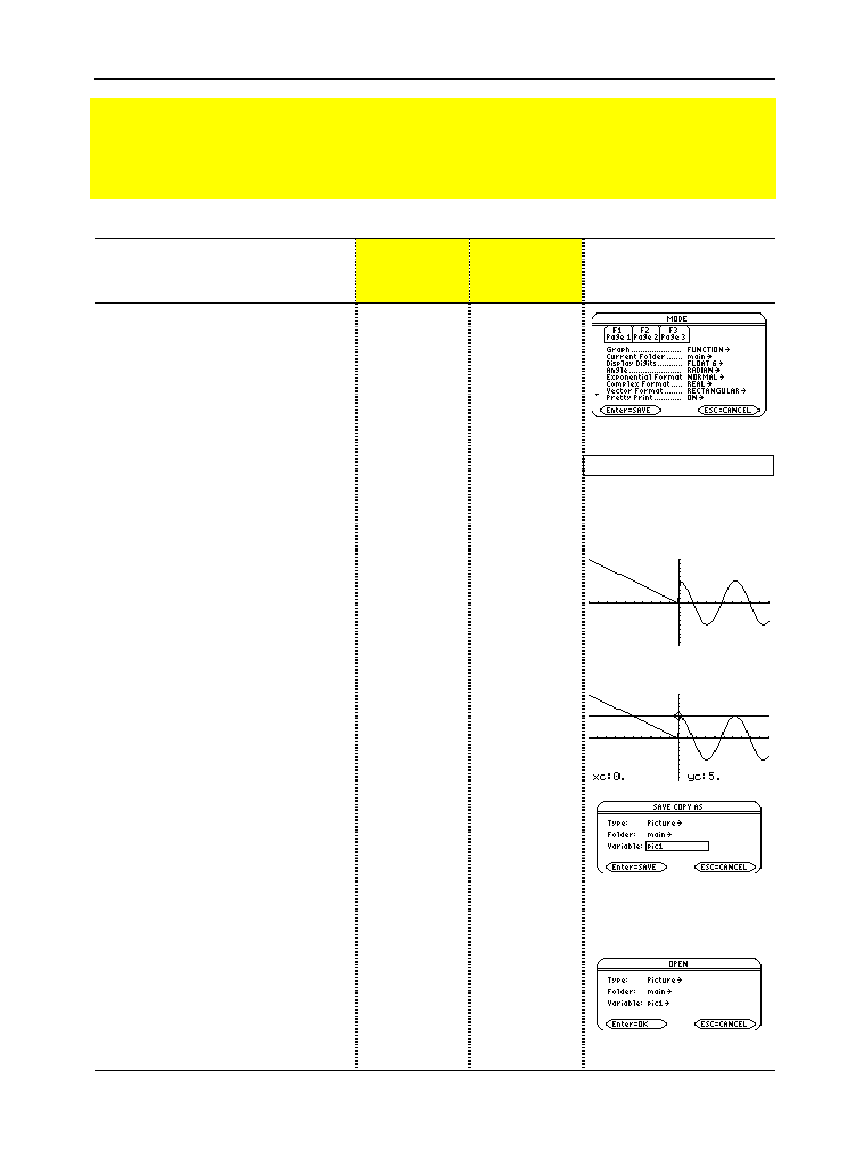
Preview of Additional Graphing Topics
From the Home screen, graph the piecewise defined function: y =
ì
x when x < 0 and
y = 5 cos(x) when x
‚
0. Draw a horizontal line across the top of the cosine curve. Then
save a picture of the displayed graph.