


Chapter 1: Getting Started 11
01START DOC TI
-
89/TI
-
92Plus:Getting Started (English) BobFedorisko Revised:02/23/01 10:47 AM Printed: 02/23/01 2:10 PM Page 11 of 12
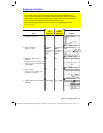
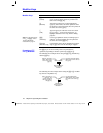
Steps
³
TI
.
89
Keystrokes
›
TI
.
92 Plus
Keystrokes Display
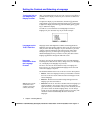
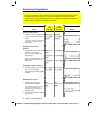
1. Display the Y= Editor.
¥#
¥#
2. Enter the function
(abs(x
2
ì
3)
ì
10)/2
.
c½
A
¸
X
Z
2
|
3
d|
10
de
2
¸
c2½
A
¸
X
Z
2
|
3
d|
10
de
2
¸
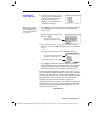
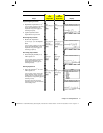
3. Display the graph of the
function.
Select
6:ZoomStd
by pressing
6
or by
moving the cursor to
6:ZoomStd
and
pressing
¸
.
„
6
„
6
4. Turn on Trace.
The tracing cursor, and the x and y
coordinates are displayed.
…
…
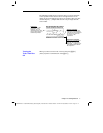
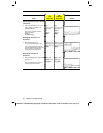
5.
Open the
MATH
menu and select
3:Minimum
.
‡DD¸
‡DD¸
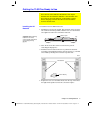
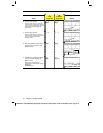
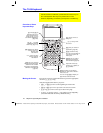
Graphing a Function
The example in this section demonstrates some of the graphing capabilities of the
TI
-
89 / TI
-
92 Plus. It illustrates how to graph a function using the Y= Editor. You will learn
how to enter a function, produce a graph of the function, trace a curve, find a minimum
point, and transfer the minimum coordinates to the Home screen.
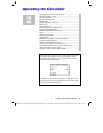
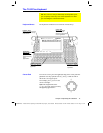
Explore the graphing capabilities of the TI
-
89 / TI
-
92 Plus by graphing the function
y=(|x
2
ì
3|
ì
10)/2
.
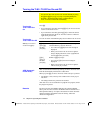
entry line
“pretty print”
display of the
function in the
entry line
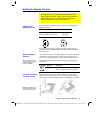
tracing
cursor