


Chapter 10: 3D Graphing 155
10_3D.DOC TI-89/TI-92 Plus: 3D Graphing (English) Susan Gullord Revised: 02/23/01 11:00 AM Printed: 02/23/01 4:22 PM Page 155 of 22
Steps
³
TI
-
89
Keystrokes
›
TI
-
92 Plus
Keystrokes Display
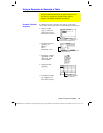
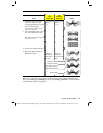
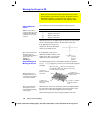
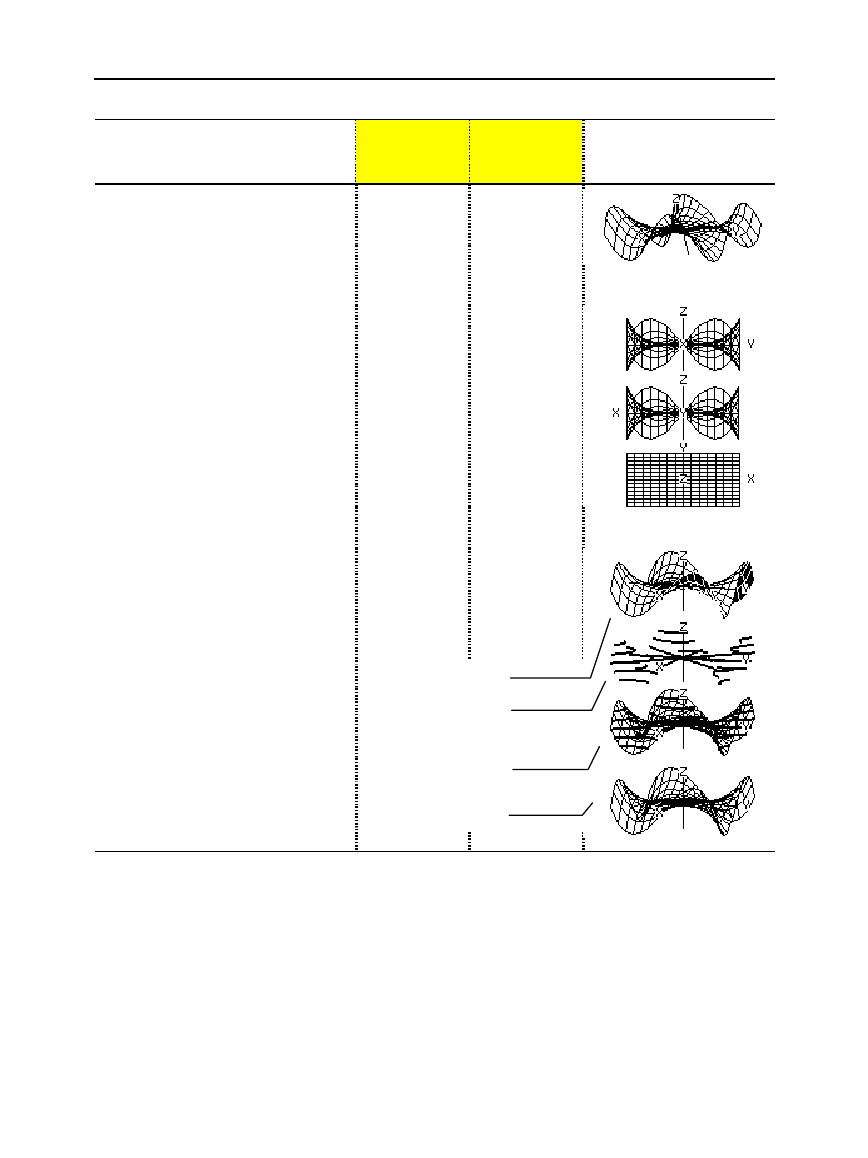
6. Return the graph to its initial
orientation. Then move the
viewing angle along the “viewing
orbit” around the graph.
For information about the viewing
orbit, refer to page 164.
0
(zero, not the
letter O)
AAA
0
(zero, not the
letter O)
AAA
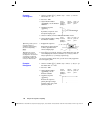
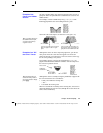
7. View the graph along the x axis,
the y axis, and then the z axis.
XX
This graph has the same shape along
the y axis and x axis.
YY
ZZ
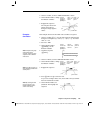
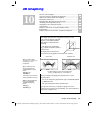
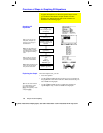
8. Return to the initial orientation.
00
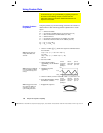
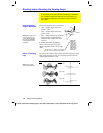
9. Display the graph in different
graph format styles.
Í
(press
Í
to
switch from
each style to
the next)
F
(press
F
to
switch from
each style to the
next)
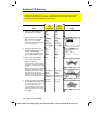
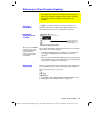
Note:
You can also display the graph as an implicit plot by using the
GRAPH FORMATS
dialog
box (
ƒ
9
or
TI
-
89
:
¥Í
TI
-
92 Plus:
¥
F
). If you press
TI
-
89
:
Í
TI
-
92 Plus:
F
to switch between
styles, the implicit plot is not displayed.
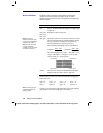
HIDDEN SURFACE
WIRE FRAME
WIRE AND CONTOUR
CONTOUR LEVELS
(may require extra time
to calculate contours)