


148 Chapter 9: Sequence Graphing
09SEQUEN.DOC TI-89/TI-92 Plus: Sequence Graphing (English) Susan Gullord Revised: 02/23/01 10:59 AM Printed: 02/23/01 2:14 PM Page 148 of 14
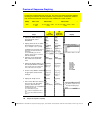
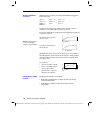
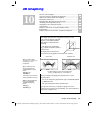
1. On the Y= Editor (
¥#
), define
u1(n) =
ë
.8u1(n
ì
1) + 3.6
. Set
initial value
ui1 =
ë
4
.
2. Set
Axes = TIME
.
3. On the Window Editor
(
¥$
), set the Window
variables.
nmin=1. xmin=0. ymin=
ë
10.
nmax=25. xmax=25. ymax=10.
plotstrt=1. xscl=1. yscl=1.
plotstep=1.
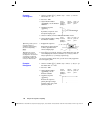
4. Graph the sequence
(
¥%
).
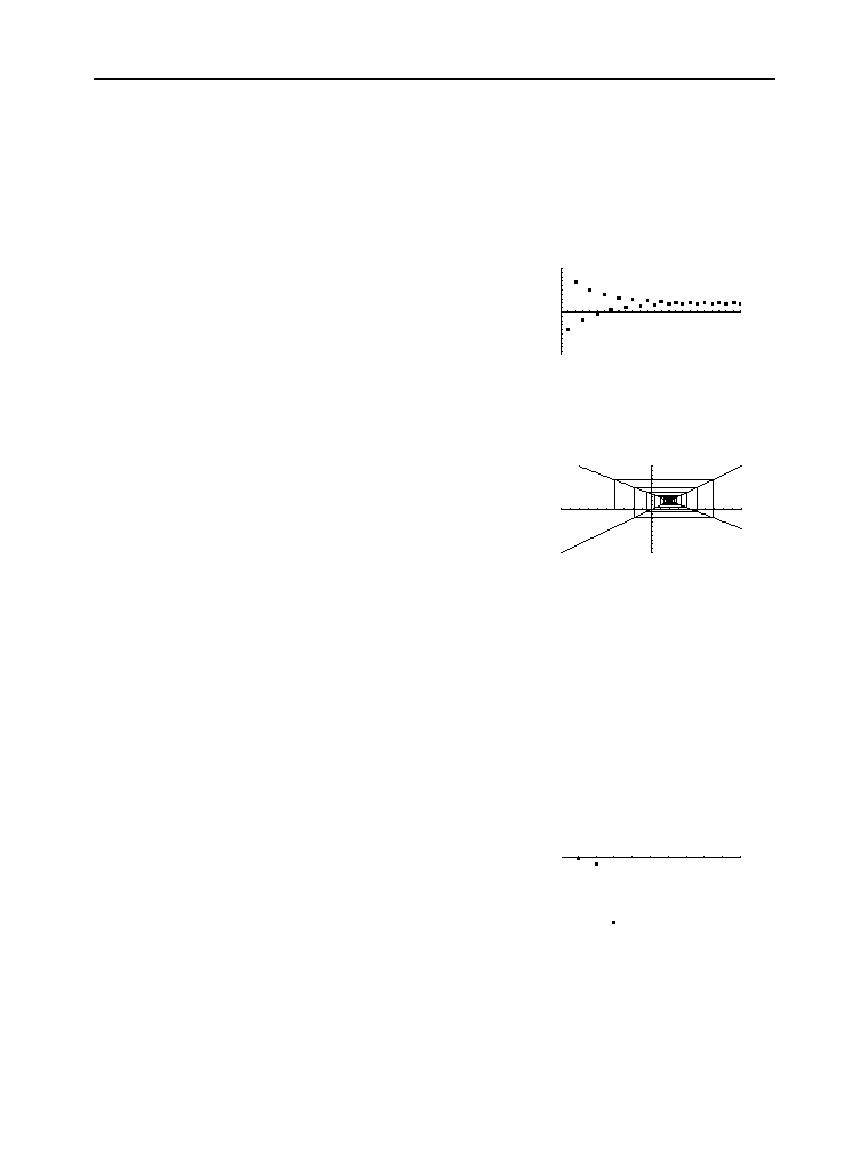
By default, a sequence uses
the
Square
display style.
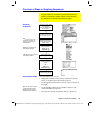
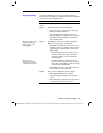
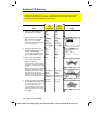
5. On the Y= Editor, set
Axes = WEB
and
Build Web = AUTO
.
6. On the Window Editor, change
the Window variables.
nmin=1. xmin=
ë
10. ymin=
ë
10.
nmax=25. xmax=10. ymax=10.
plotStrt=1. xscl=1. yscl=1.
plotStep=1.
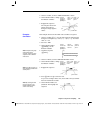
7. Regraph the sequence.
Web plots are always shown
as lines, regardless of the
selected display style.
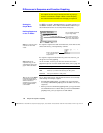
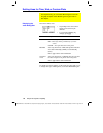
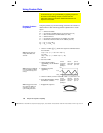
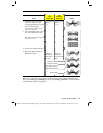
8. Press
…
. As you press
B
, the trace cursor follows the web. The
screen displays the cursor coordinates
nc
,
xc
, and
yc
(where
xc
and
yc
represent
u(n
ì
1)
and
u(n)
, respectively).
As you trace to larger values of
nc
, you can see
xc
and
yc
approach
the convergence point.
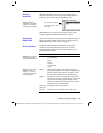
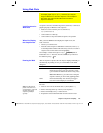
1. On the Y= Editor (
¥#
), define
u1(n) = 3.2u1(n
ì
1)
ì
.8(u1(n
ì
1))
2
.
Set initial value
ui1 = 4.45
.
2. Set
Axes = TIME
.
3. On the Window Editor
(
¥$
), set the
Window variables.
nmin=0. xmin=0. ymin=
ë
75.
nmax=10. xmax=10. ymax=10.
plotStrt=1. xscl=1. yscl=1.
plotStep=1.
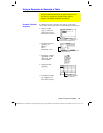
4. Graph the sequence
(
¥%
).
Because the sequence
quickly diverges to large
negative values, only a few
points are plotted.
Example:
Convergence
Tip: During a trace, you can
move the cursor to a
specified n value by typing
the value and pressing
¸
.
Tip: When the nc value
changes, the cursor is on
the sequence. The next time
y
ou press
B
, nc stays the
same but the cursor is now
on the y=x reference line.
Example:
Divergence
u(n)
n
u(n)
y=x
u(n
ì
1)
u(n)
n
y=
ë
.8x + 3.6