


Chapter 10: 3D Graphing 171
10_3D.DOC TI-89/TI-92 Plus: 3D Graphing (English) Susan Gullord Revised: 02/23/01 11:00 AM Printed: 02/23/01 4:22 PM Page 171 of 22
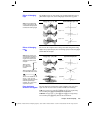
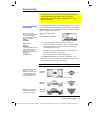
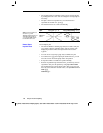
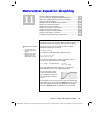
In 2D function graphing mode,
equations have an explicit form
y=f(x), where y is unique for
each value of x.
Many equations, however, have
an implicit form f(x,y)=g(x,y),
where you cannot explicitly
solve for y in terms of x or for x
in terms of y.
By using implicit plots in 3D graphing mode, you can graph these
implicit forms without solving for y or x.
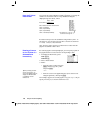
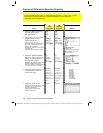
Rearrange the implicit form as
an equation set to zero.
f(x,y)
ì
g(x,y)=0
In the Y= Editor, enter the non-
zero side of the equation. This
is valid because an implicit plot
automatically sets the equation
equal to zero.
z1(x,y)=f(x,y)
ì
g(x,y)
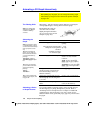
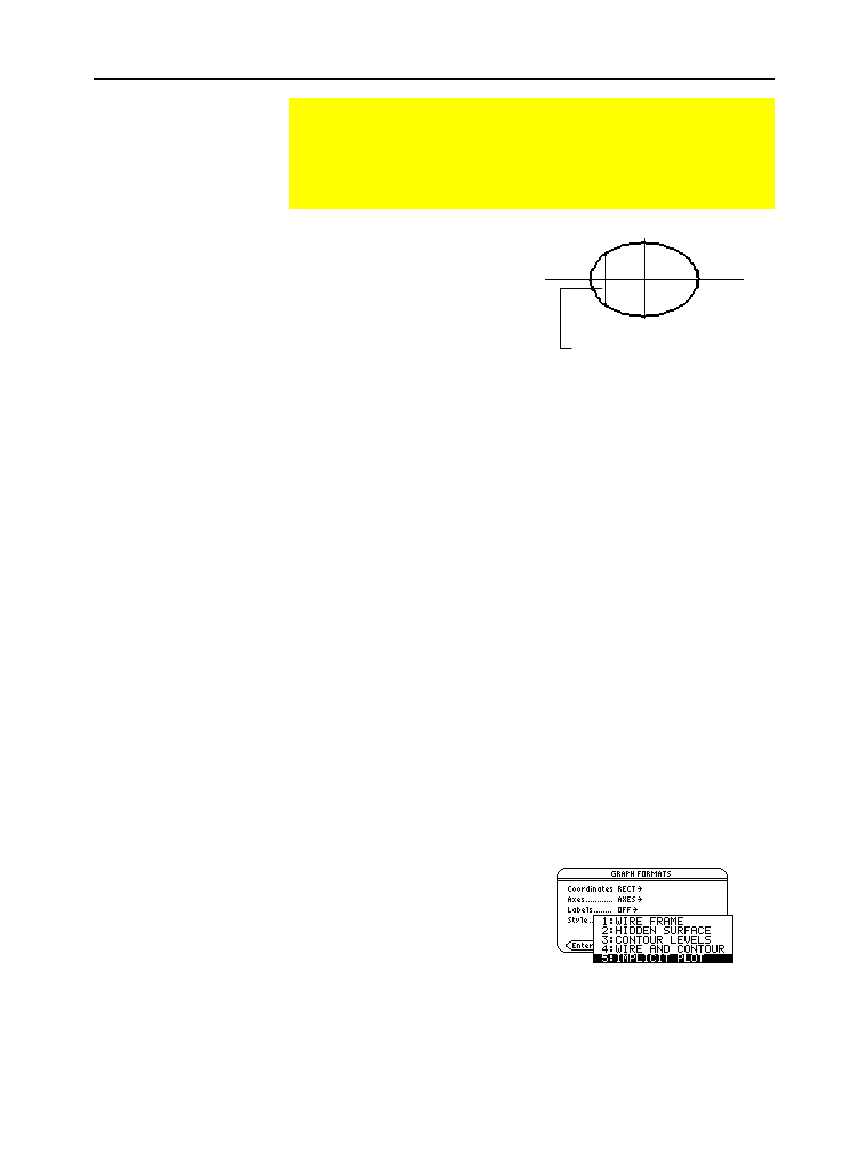
For example, given the ellipse
equation shown to the right,
enter the implicit form in the
Y= Editor.
If
x
ñ
+.5y
ñ
=30,
then
z1(x,y)=x
ñ
+.5y
ñì
30.
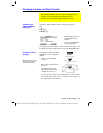
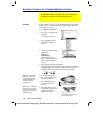
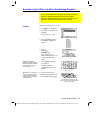
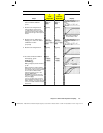
In 3D graphing mode, define an appropriate equation and graph it as
you would any 3D equation, with the following exception. Display
the
GRAPH FORMATS
dialog box from the Y= Editor, Window editor,
or Graph screen.
TI
-
89:
¥Í
TI
-
92 Plus
:
¥
F
Then set:
Style = IMPLICIT PLOT
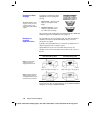
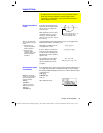
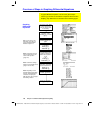
Implicit Plots
An implicit plot is used primarily as a way to graph 2D implicit
forms that cannot be graphed in function graphing mode.
Technically, an implicit plot is a 3D contour plot with a single
contour drawn for z=0 only.
Explicit and Implicit
Forms
Tip: You can also graph
many implicit forms if you
either:
• Express them as
parametric equations.
Refer to Chapter 7.
• Break them into
separate, explicit
functions. Refer to the
preview example in
Chapter 6.
Selecting the Graph
Format Style
Note: From the Graph
screen, you can switch to
the other graph format
styles by pressing:
TI
-
89
:
Í
TI
-
92 Plus:
F
However, to return to
IMPLICIT PLOT
press:
TI
-
89
:
¥Í
TI
-
92 Plus
:
¥
F
y is not unique for each x, so
you cannot graph this in
function graphing mode.