472 Appendix A: Functions and Instructions
8992APPA.DOC TI-89 / TI-92 Plus: Appendix A (US English) Susan Gullord Revised: 02/23/01 1:48 PM Printed: 02/23/01 2:21 PM Page 472 of 132
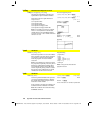
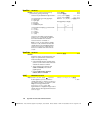
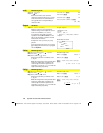
NewPlot
CATALOG
NewPlot
n
,
type
,
xList
[
,
[
yList
], [
frqList
], [
catList
],
[
includeCatList
], [
mark
] [
,
bucketSize
]]
Creates a new plot definition for plot number
n
.
type
specifies the type of the graph plot.
1 = scatter plot
2 = xyline plot
3 = box plot
4 = histogram
5 = modified box plot
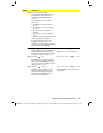
mark
specifies the display type of the mark.
1 =
è
(box)
2 = × (cross)
3 = + (plus )
4 =
é
(square)
5 =
ø
(dot)
bucketSize
is the width of each histogram
“bucket” (
type
= 4), and will vary based on
the window variables
xmin
and
xmax
.
bucketSize
must be >0. Default = 1.
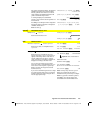
Note:
n
can be 1–9. Lists must be variable
names or c1–c99 (columns in the last data
variable shown in the Data/Matrix Editor),
except for
includeCatList
, which does not
have to be a variable name and cannot be
c1–c99.
FnOff
¸
Done
P
l
otsOff
¸
Done
{1
,2,3,4
}
!
L
1
¸
{1
2 3 4
}
{
2,3,4,5
}
!
L2
¸
{
2 3 4 5
}
NewP
l
ot
1
,
1
,L
1
,L2,,,,4
¸
Done
Press
¥%
to display:
NewProb
CATALOG
NewProb
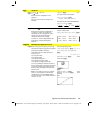
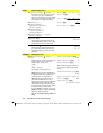
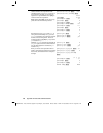
Performs a variety of operations that let you
begin a new problem from a cleared state
without resetting the memory.
•
Clears all single-character variable names
(
Clear a–z
) in the current folder, unless the
variables are locked or archived.
•
Turns off all functions and stat plots
(
FnOff
and
PlotsOff
) in the current
graphing mode.
•
Perfoms
ClrDraw
,
ClrErr
,
ClrGraph
,
ClrHome
,
ClrIO
, and
ClrTable
.
NewProb
¸
Done
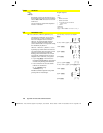
nInt()
MATH/Calculus menu
nInt(
expression1, var, lower, upper
)
⇒
expression
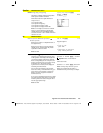
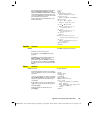
If the integrand
expression1
contains no
variable other than
var
, and if
lower
and
upper
are constants, positive
ˆ
, or negative
ˆ
, then
nInt()
returns an approximation of
‰
(
expression1
,
var
,
lower
,
upper
)
. This
approximation is a weighted average of some
sample values of the integrand in the interval
lower<var<upper
.
nInt(
e
^(
ë
x^2),x,
ë
1,1)
¸
1.493
...


