


112 Chapter 6: Basic Function Graphing
06BASFUN.DOC TI-89/TI-92 Plus: Basic Function Graphing (English) Susan Gullord Revised: 02/23/01 4:09 PM Printed: 02/23/01 4:18 PM Page 112 of 22
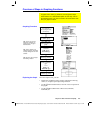
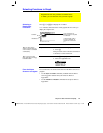
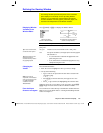
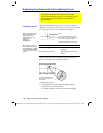
From the Y= Editor:
1. Move the cursor to highlight the applicable function.
2. Select the
Style
menu:
TI
.
89:
Press
2ˆ
.
TI
.
92 Plus:
Press ˆ.
¦
Although the
Line
item is initially
highlighted, the function’s current style is
indicated by a
Ÿ
mark.
¦ To exit the menu without making a
change, press
N
.
3. To make a change, select the applicable style.
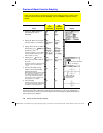
Style Description
Line
Connects plotted points with a line. This is the default.
Dot
Displays a dot at each plotted point.
Square
Displays a solid box at each plotted point.
Thick
Connects plotted points with a thick line.
Animate
A round cursor moves along the leading edge of the
graph but
does not
leave a path.
Path
A round cursor moves along the leading edge of the
graph and
does
leave a path.
Above
Shades the area above the graph.
Below
Shades the area below the graph.
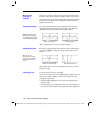
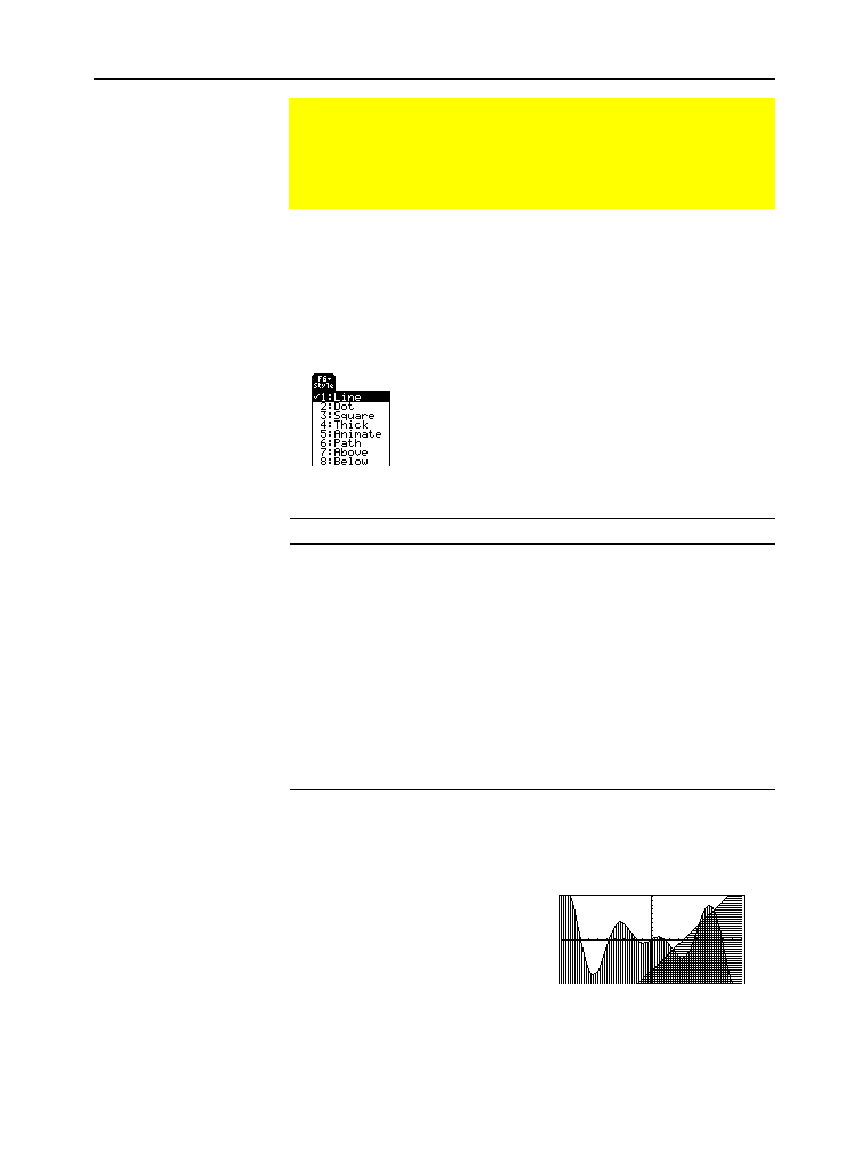
The
TI
-
89 / TI
-
92 Plus
has four shading patterns, used on a rotating
basis. If you set one function as shaded, it uses the first pattern. The
next shaded function uses the second pattern, etc. The fifth shaded
function reuses the first pattern.
When shaded areas intersect,
their patterns overlap.
You can also set a function’s style from the Home screen or a
program. Refer to the
Style
command in Appendix A.
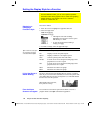
Setting the Display Style for a Function
For each defined function, you can set a style that specifies
how that function will be graphed. This is useful when graphing
multiple functions. For example, set one as a solid line,
another as a dotted line, etc.
Displaying or
Changing a
Function’s Style
Tip: To set
Line
as the style
for all functions, press
‡
and select
4:Reset Styles
.
If You Use Above or
Below Shading
From the Home
Screen or a Program