Chapter 11: Differential Equation Graphing 193
11DIFFEQ.DOC TI-89/TI-92 Plus: Differential Equation (English) Susan Gullord Revised: 02/23/01 11:04 AM Printed: 02/23/01 2:15 PM Page 193 of 26
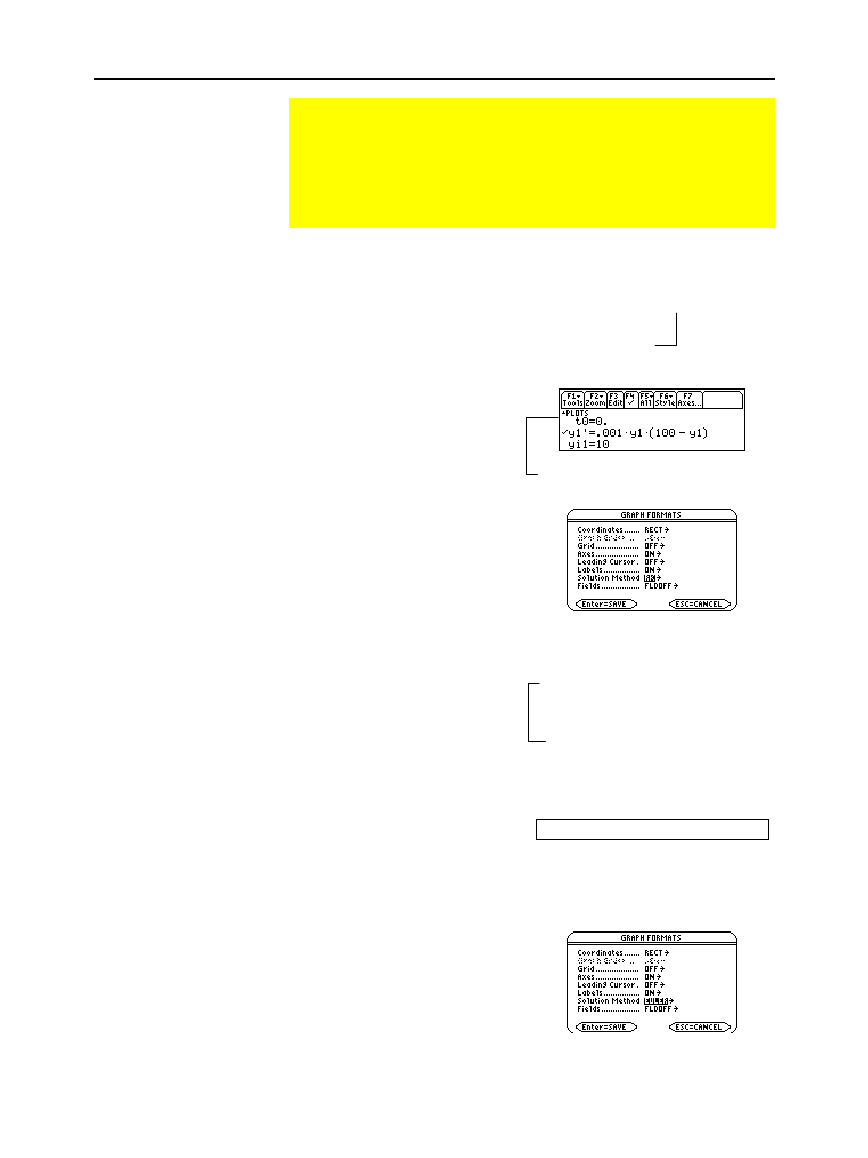
1. Press
3
and set
Graph=DIFF EQUATIONS
.
2. Express the 1st-order equation
in terms of
y1'
and
y1
.
y1'=.001y1
ù
(100
ì
y1)
3. Enter the equation in the
Y= Editor (
¥#
).
4. Enter the initial condition:
yi1=10
5. Press:
ƒ
9
— or —
TI
-
89:
¥
Í
TI
-
92 Plus:
¥
F
Set
Solution Method = RK
and
Fields = FLDOFF
.
6. In the Window Editor
(
¥$
), set the
Window variables.
t0=0. xmin=
ë
1. ncurves=0.
tmax=100. xmax=100. diftol=.001
tstep=1. xscl=1.
tplot=0. ymin=
ë
10.
ymax=10.
yscl=1.
7. In the Home screen
TI
-
89
:
"
TI
-
92 Plus:
¥
"
use
BldData
to create a data
variable containing the
RK
graphing points.
BldData rklog
8. Return to the Y= Editor,
press:
ƒ
9
— or —
TI
-
89:
¥
Í
TI
-
92 Plus:
¥
F
Set
Solution Method = EULER
.
Example Comparison of RK and Euler
Consider a logistic growth model dP/dt = .001
ù
P
ù
(100
ì
P),
with the initial condition P(0) = 10. Use the
BldData
instruction
to compare the graphing points calculated by the RK and Euler
solution methods. Then plot those points along with a graph of
the equation’s exact solution.
Example
Tip: To speed up graphing
times, clear any other
equations in the Y= Editor.
With
FLDOFF
, all equations
are evaluated even if they
are not selected.
Note: You do not need to
graph the equation before
using
BldData
. For more
information about
BldData
,
refer to Appendix A.
t0 is the time at which the initial
condition occurs. By default, t0=0.
Important:
Change tstep from .1
(its default) to 1. Otherwise,
BldData
calculates too many
rows for the data variable and a
Dimension error occurs.
Do not use implied multiplication between
the variable and parentheses. If you do, it
is treated as a function call.
