


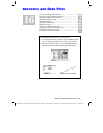

Chapter 16: Statistics and Data Plots 257
16STATS.DOC TI-89/TI-92 Plus: Statistics and Data Plots (English) Susan Gullord Revised: 02/23/01 1:12 PM Printed: 02/23/01 2:17 PM Page 257 of 22
Steps
³
TI
-
89
Keystrokes
›
TI
-
92 Plus
Keystrokes Display
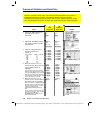
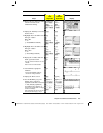
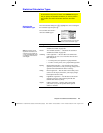
22. Enter a title for column 6. Define
column 6’s header as the
residuals for LinReg.
BC2™
RESID
j
¸
†j
C2
|
j
C5
¸
BC
RESID
¸
†
C2
|
C5
¸
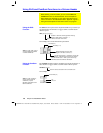
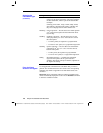
23. Display the
Plot Setup
screen and
deselect Plot 1.
„†
„†
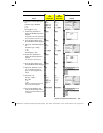
24. Highlight Plot 2 and define it as:
Plot Type = Scatter
Mark = Box
x = C1
y = C4
(MedMed residuals)
Dƒ
D
D
C
j
1
D
j
C4
¸
¸
Dƒ
D
D
C1
D
C4
¸
¸
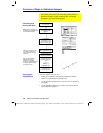
25. Highlight Plot 3 and define it as:
Plot Type = Scatter
Mark = Plus
x = C1
y = C6
(LinReg residuals)
Dƒ
D
B
3
D
C
j
1
D
j
C6
¸
¸
Dƒ
D
B
3
D
C1
D
C6
¸
¸
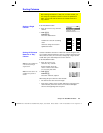
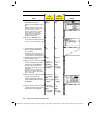
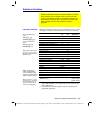
26. Display the Y= Editor and turn
all the
y(x)
functions off.
From
‡
, select
3:Functions Off
, not
1:All Off
.
Plots 2 and 3 are still selected.
¥#
‡
3
¥#
‡
3
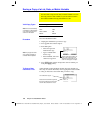
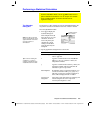
27. Use
ZoomData
to graph the
residuals.
›
marks the MedMed residuals;
+
marks the LinReg residuals.
„
9
„
9
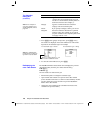
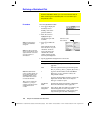
28. Display the Home screen.
"
¥"
29. Use the MedMed (
y1(x)
) and
LinReg (
y2(x)
) regression
equations to calculate values for
x
=
300
(300,000 population).
The
round
function
(2I 13)
ensures that results show an integer
number of buildings.
After calculating the first result, edit
the entry line to change y1 to y2.
2I
13
Y1
c
300
d
b
0
d¸
B
AAAAA
AAA0
2
¸
2I
13
Y1
c
300
d
b
0
d¸
B
AAAAA
AAA0
2
¸