


Chapter 10: 3D Graphing 157
10_3D.DOC TI-89/TI-92 Plus: 3D Graphing (English) Susan Gullord Revised: 02/23/01 11:00 AM Printed: 02/23/01 4:22 PM Page 157 of 22
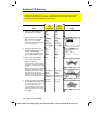
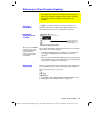
Use
3
to set
Graph = 3D
before you define equations or set
Window variables. The Y= Editor and the Window Editor let you
enter information for the
current
Graph
mode setting only.
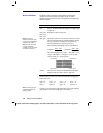
The Y= Editor maintains an independent function list for each
Graph
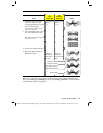
mode setting. For example, suppose:
¦
In
FUNCTION
graphing mode, you define a set of
y(x)
functions.
You change to
3D
graphing mode and define a set of
z(x,y)
equations.
¦ When you return to
FUNCTION
graphing mode, your
y(x)
functions
are still defined in the Y= Editor. When you return to
3D
graphing
mode, your
z(x,y)
equations are still defined.
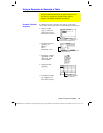
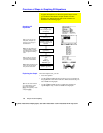
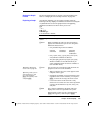
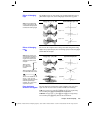
Because you can graph only one 3D equation at a time, display styles
are not available. On the Y= Editor,
Style
toolbar menu is dimmed.
For 3D equations, however, you can use:
ƒ
9
—
or
—
TI
-
89
:
¥Í
TI
-
92 Plus
:
¥
F
to set the
Style
format to
WIRE FRAME
or
HIDDEN SURFACE
. Refer
to “Changing the Axes and Style Formats” on page 165.
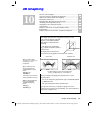
Differences in 3D and Function Graphing
This chapter assumes that you already know how to graph y(x)
functions as described in Chapter 6: Basic Function Graphing.
This section describes the differences that apply to 3D
equations.
Setting the
Graph Mode
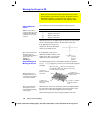
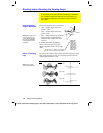
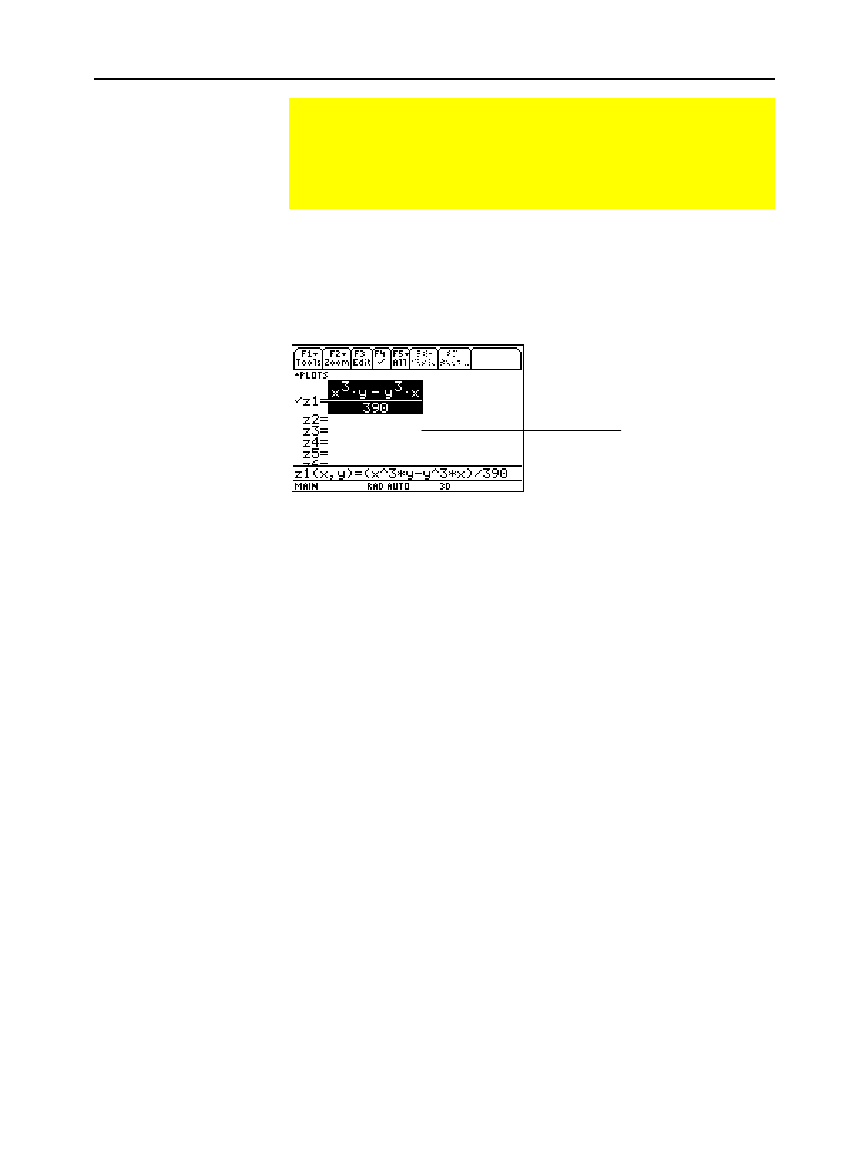
Defining 3D
Equations on the
Y= Editor
Tip: You can use the Defin
e
command from the Home
screen (see Appendix A) to
define functions and
equations for any graphing
mode, regardless of the
current mode.
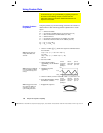
Selecting the
Display Style
You can define 3D
equations for z1(x,y)
through z99(x,y).